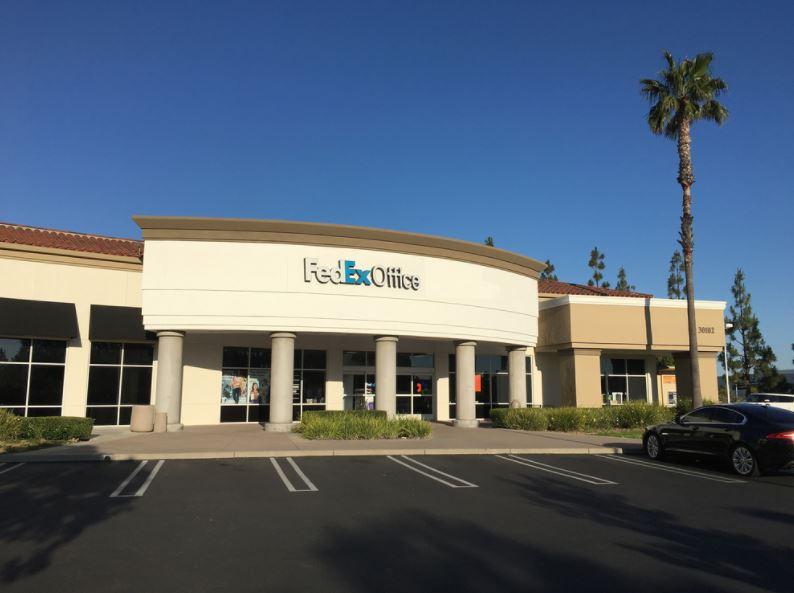
Retail Space
30092 Santa Margarita Parkway Rancho Santa Margarita, CA 92688
30092 Santa Margarita Parkway Rancho Santa Margarita, CA 92688
Details & Description
Property Highlights
• Serves the communities of Rancho Santa Margarita, Mission Viejo and Foothill Ranch
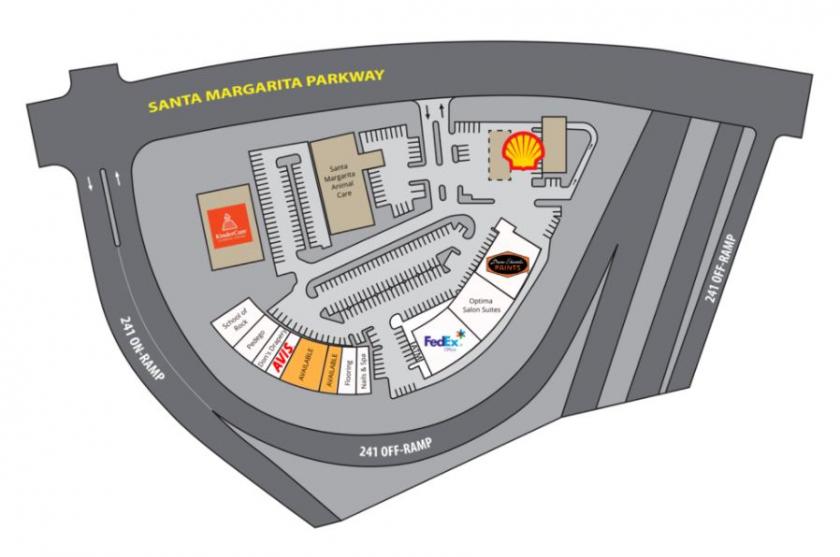
• Visible to 241 Freeway located directly off Santa Margarita Parkway
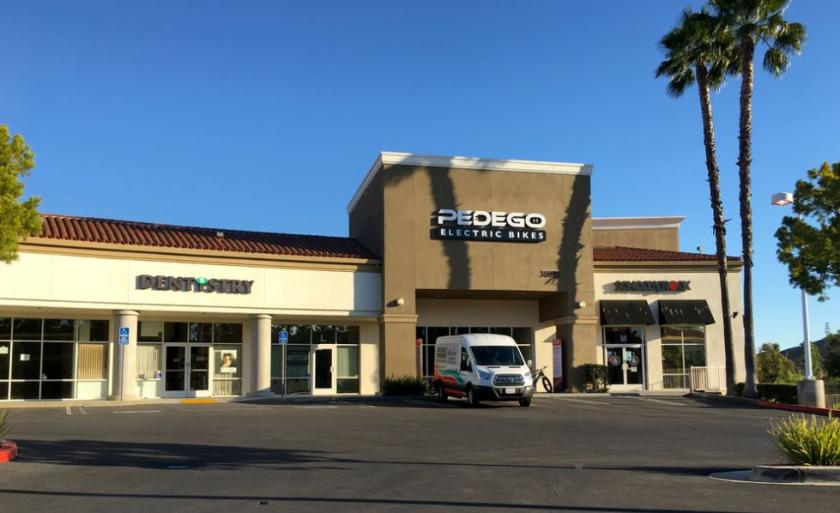
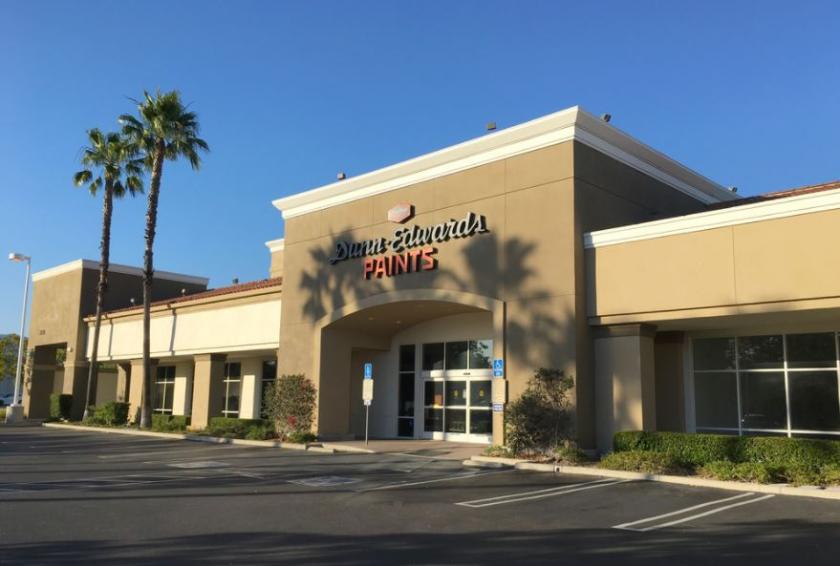
Additional Photos
Listing Agents

Matt Hammond
O: 714-210-6711
mhammond@coreland.com
O: 714-210-6711
mhammond@coreland.com
While we strive to provide the most accurate information, all listing information, and demographic data, is provided by third-parties. As such, MyEListing will not be responsible for the accuracy of the information. It is strongly recommended that you verify all information with the listing agent, and any relevant agencies, prior to making any decisions.


