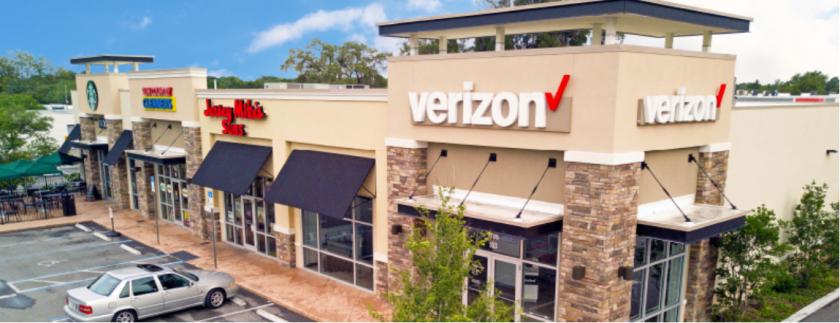
1-Mile | 3-Miles | 5-Miles | ||
---|---|---|---|---|
Total Population | 14,073 | 116,645 | 285,567 | |
Population Median Age | 48 | 48 | 46 | |
Population by Age | 0-9 Yrs | 1150 (8%) | 9802 (8%) | 24988 (8%) |
10-19 Yrs | 1149 (8%) | 9629 (8%) | 26709 (9%) | |
20-29 Yrs | 1361 (9%) | 10579 (9%) | 27588 (9%) | |
30-39 Yrs | 1393 (9%) | 12629 (10%) | 29948 (10%) | |
40-49 Yrs | 1560 (11%) | 13021 (11%) | 33511 (11%) | |
50-59 Yrs | 1967 (13%) | 17194 (14%) | 43474 (15%) | |
60-69 Yrs | 2455 (17%) | 19517 (16%) | 45436 (15%) | |
70+ Yrs | 3039 (21%) | 24274 (20%) | 53913 (18%) | |
Median HH Income | $42,413 | $50,543 | $53,457 | |
Total Household Income | < 24K | 1989 (30%) | 11744 (22%) | 26544 (21%) |
25-49K | 1677 (25%) | 13835 (26%) | 31789 (25%) | |
50-74K | 1118 (17%) | 8691 (16%) | 20628 (16%) | |
75-99K | 611 (9%) | 6052 (11%) | 14388 (11%) | |
100-199K | 897 (13%) | 9047 (17%) | 23787 (19%) | |
200K+ | 164 (2%) | 2241 (4%) | 6424 (5%) | |
Highest Education Level | No Diploma | 1016 | 7379 | 17269 |
Diploma or GED | 3647 | 26448 | 60643 | |
Some College | 2300 | 20690 | 48143 | |
Assoc. Degree | 1268 | 8565 | 21696 | |
Bachelors Degree | 2032 | 19421 | 48631 | |
Higher Degree | 850 | 10260 | 25329 | |
Total Housing Units | 7,257 | 60,688 | 148,981 | |
--Owner-Occupied | 4,172 | 36,734 | 83,497 | |
--Renter-Occupied | 2,285 | 14,875 | 40,063 | |
Owner-Occupied Values | < 100K | 1319 | 8909 | 15794 |
100-199K | 1291 | 10527 | 22468 | |
200-299K | 1196 | 8883 | 20203 | |
300-399K | 237 | 4117 | 11375 | |
400-499K | 75 | 1967 | 5265 | |
500K+ | 55 | 2331 | 8392 | |
Total Working Age Population | 12,412 | 101,624 | 245,021 | |
In Work Force | 6,649 | 55,600 | 138,972 | |
Not In Work Force | 5,763 | 46,024 | 106,049 | |
Workforce Employed | 6,250 | 52,841 | 131,806 | |
Workforce Unemployed | 360 | 2,635 | 6,933 | |
Civlian Workforce | 6,610 | 55,476 | 138,739 | |
Military Workforce | 38 | 123 | 233 | |
Total Households | 6,457 | 51,610 | 123,560 | |
Family Households | 2,970 | 28,389 | 70,251 | |
Non-Family Households | 3,487 | 23,221 | 53,309 | |
Married Couple | 2,397 | 21,827 | 53,058 | |
Other Family | 573 | 6,562 | 17,193 | |
Married w/Child | 661 | 5,778 | 14,390 | |
Single Male w/Child | 81 | 573 | 2,523 | |
Single Female w/Child | 111 | 2,201 | 5,691 |
Population Change Last Two Decades - Plus Projection
2000 | % | 2010 | % | 2020 | % | 2030 | |
---|---|---|---|---|---|---|---|
Florida | 15,982,378 | +18 | 18,801,310 | +14 | 21,517,610 | +13 | 24,340,457 |
Hillsborough County | 998,948 | +23 | 1,229,226 | +19 | 1,466,803 | +16 | 1,708,550 |
Pinellas County | 921,482 | -1 | 916,542 | +7 | 983,883 | +5 | 1,034,290 |
Total Working Age Population:
Total Households:
Total Working Age Population:
Total Households:
Total Working Age Population:
Total Households: