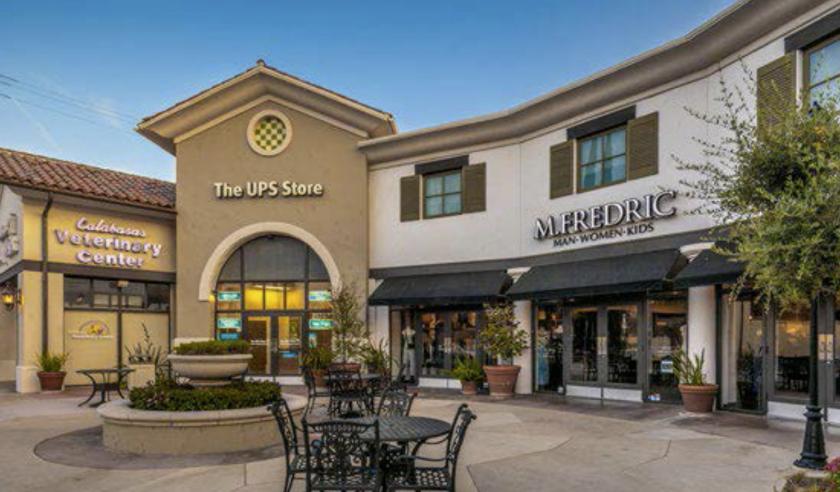
Retail Space
22277 Mulholland Highway Calabasas, CA 91302
22277 Mulholland Highway Calabasas, CA 91302
Details & Description
Property Highlights
• Excellent demographics with high disposable incomes in surrounding area
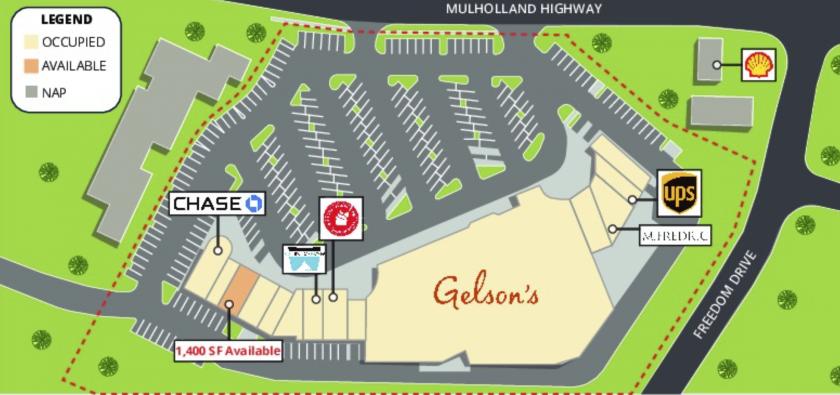
• Top performing Gelsons store within Southern California
Listing Agents

Zach Leffers
O: 949-270-8203
M: 260-494-2634
zach.leffers@srsre.com
O: 949-270-8203
M: 260-494-2634
zach.leffers@srsre.com
While we strive to provide the most accurate information, all listing information, and demographic data, is provided by third-parties. As such, MyEListing will not be responsible for the accuracy of the information. It is strongly recommended that you verify all information with the listing agent, and any relevant agencies, prior to making any decisions.