Commercial Land
4559 Belt Line Road Addison, TX 75001
4559 Belt Line Road Addison, TX 75001
Details & Description
Property Highlights
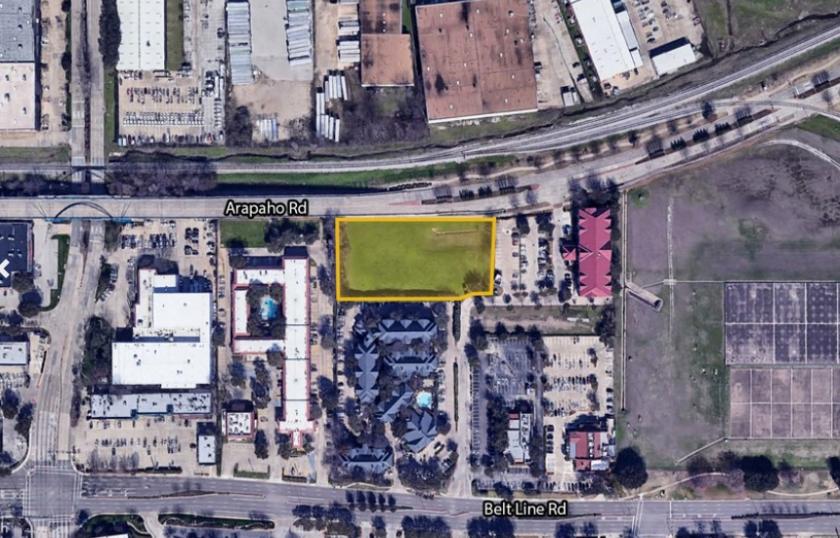
- • Commercial development site opportunity
- • 45,703 VPD along Belt Line Rdpaho Rd
- • Great visibility along Arapaho Rd
- • Zoned PD 89-015
- • 32,617 VPD along Arapaho Rd
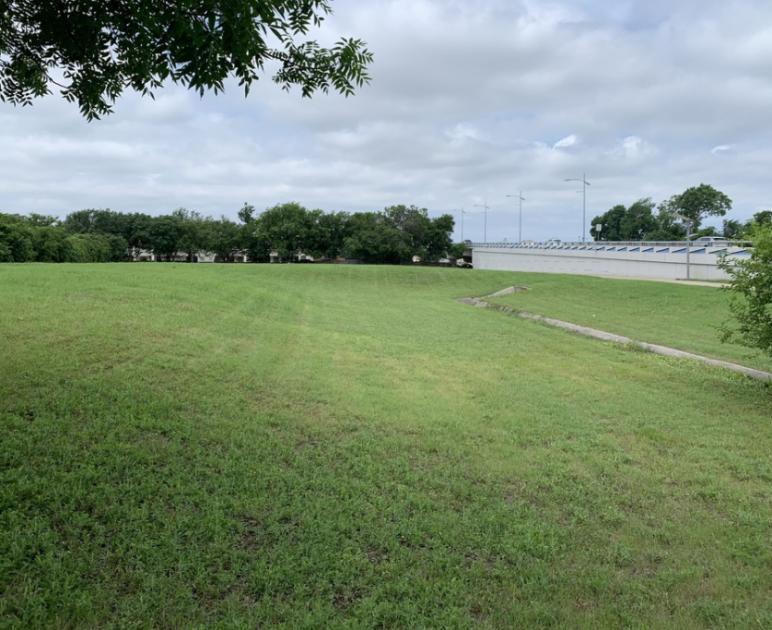
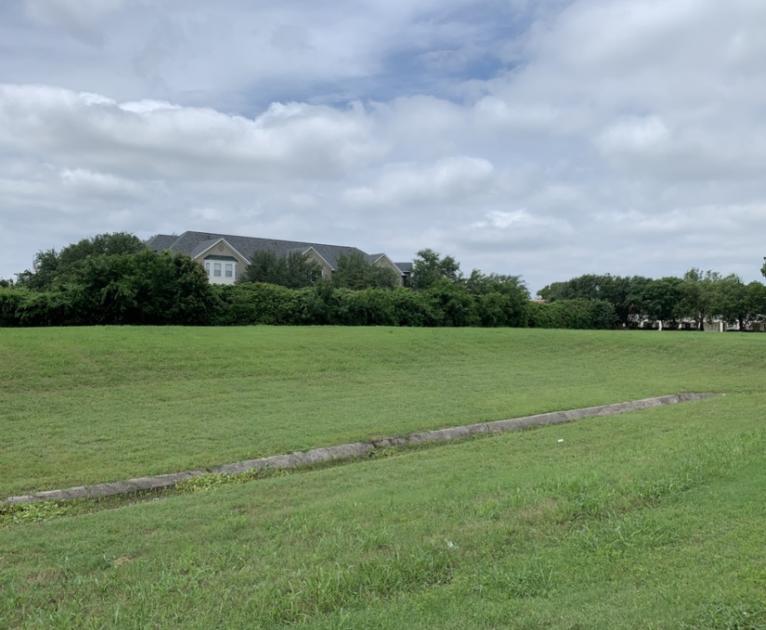
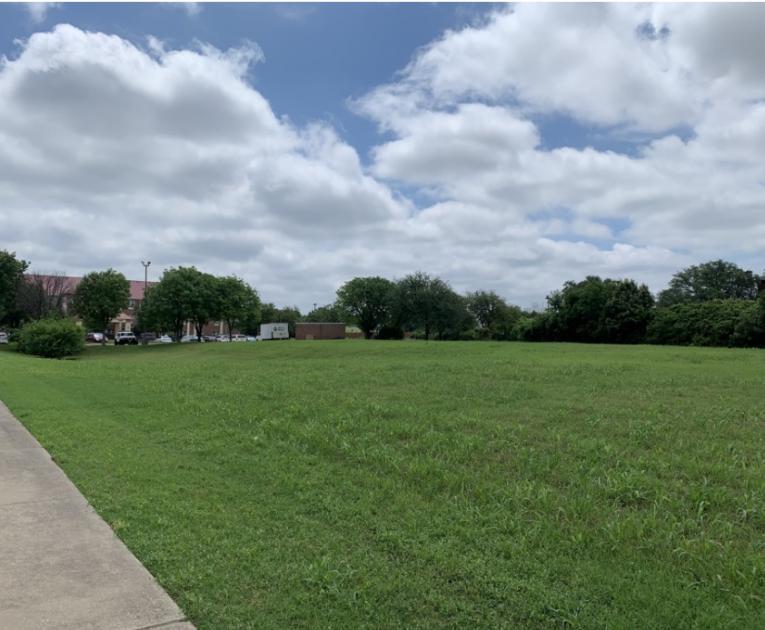
Additional Photos

Listing Agents

Jake Malone
O: 512-897-3075
jake@sayersadvisors.com
O: 512-897-3075
jake@sayersadvisors.com
While we strive to provide the most accurate information, all listing information, and demographic data, is provided by third-parties. As such, MyEListing will not be responsible for the accuracy of the information. It is strongly recommended that you verify all information with the listing agent, and any relevant agencies, prior to making any decisions.


