Office Space
1808 Aldrich Street Austin, TX 78723
1808 Aldrich Street Austin, TX 78723
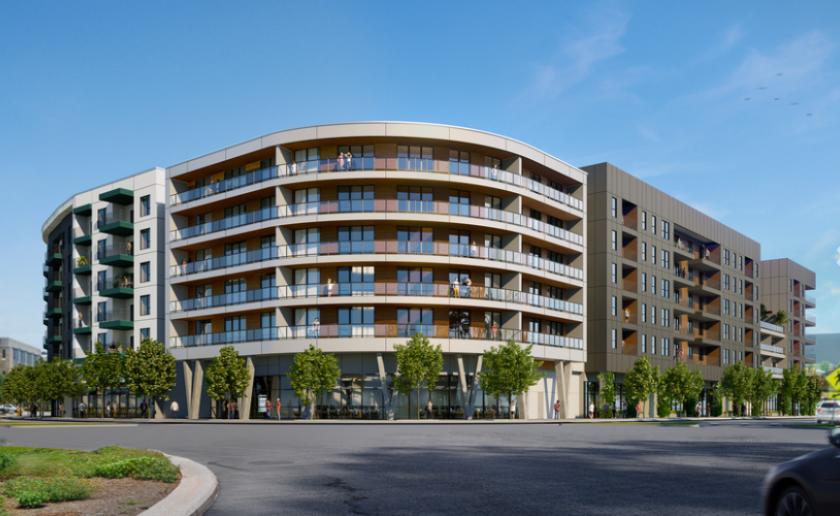
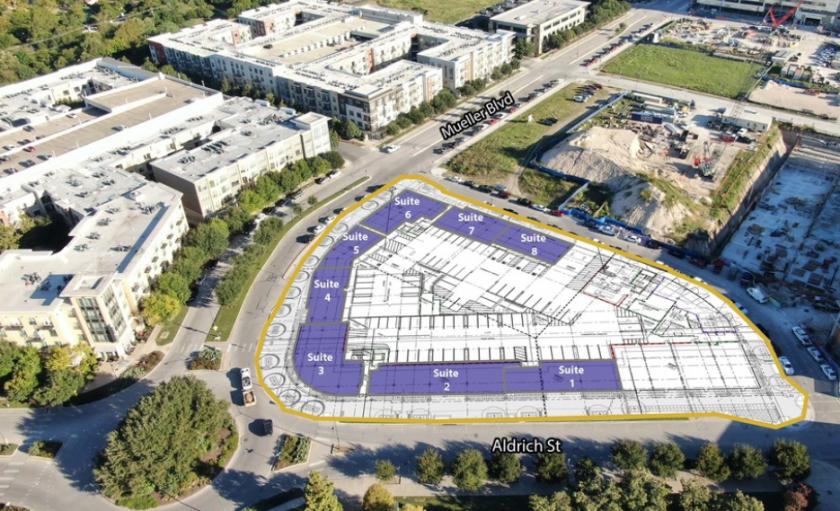
Details & Description
Property Highlights
- • Eight For-Sale Ground-Floor Commercial Condo Units
- • Unique Views Along Mueller Lake Park
- • Expected Delivery in Q2 of 2023
- • High Ceilings Allowing for Potential Mezzanine
- • Close Proximity to Shops and Amenities
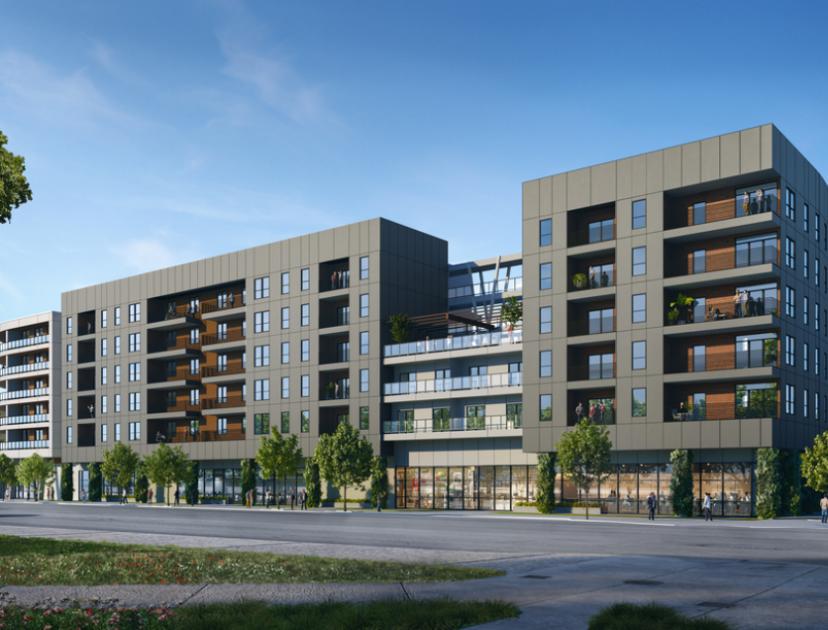
Additional Photos

Listing Agents

Paul Byars
O: 512-694-0878
paul@sayersadvisors.com
O: 512-694-0878
paul@sayersadvisors.com
While we strive to provide the most accurate information, all listing information, and demographic data, is provided by third-parties. As such, MyEListing will not be responsible for the accuracy of the information. It is strongly recommended that you verify all information with the listing agent, and any relevant agencies, prior to making any decisions.


