Commercial Land
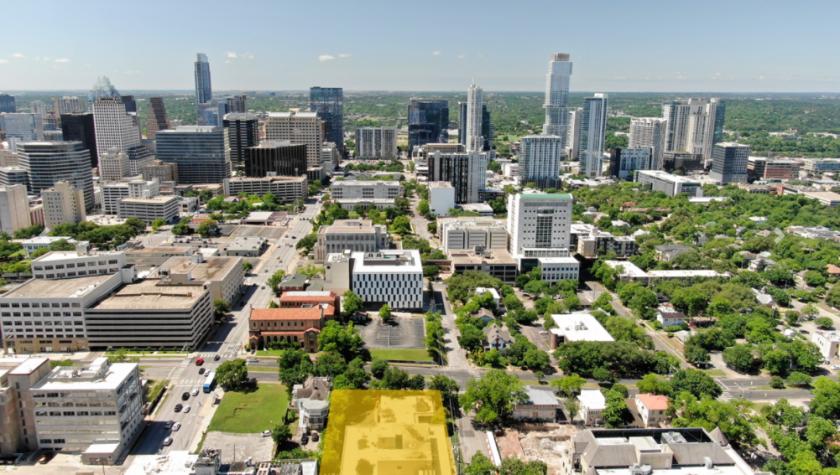
404 West 12th Street Austin, TX 78701
404 West 12th Street Austin, TX 78701
Details & Description
Property Highlights
• DMU zoning includes any combination of office retail, commercial, and residential uses
• 20,000 square feet of land measuring 125 wide x 160 deep plus rear alley.
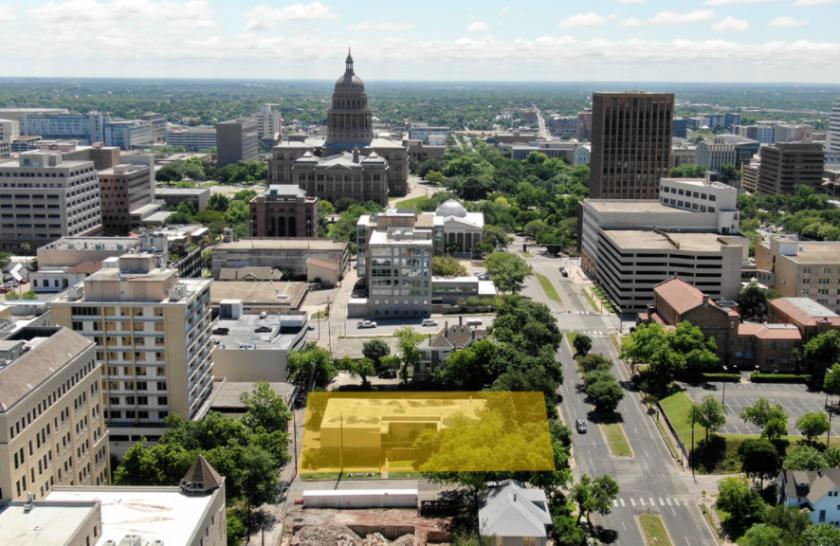
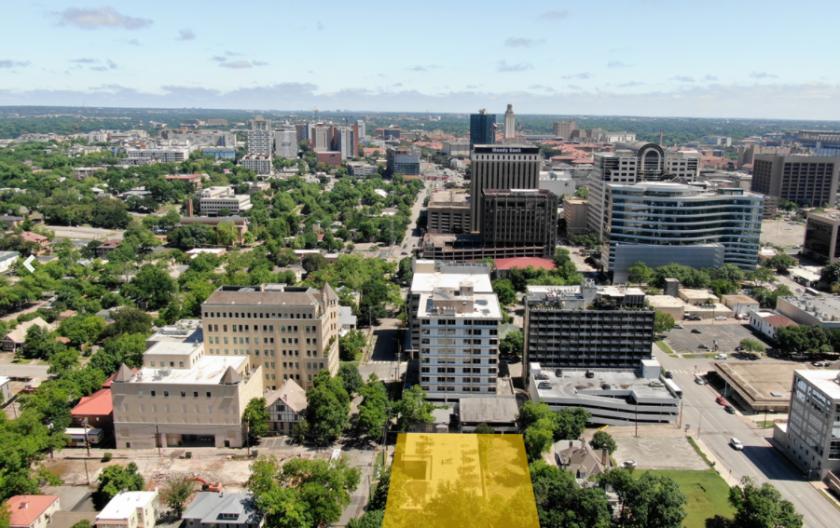
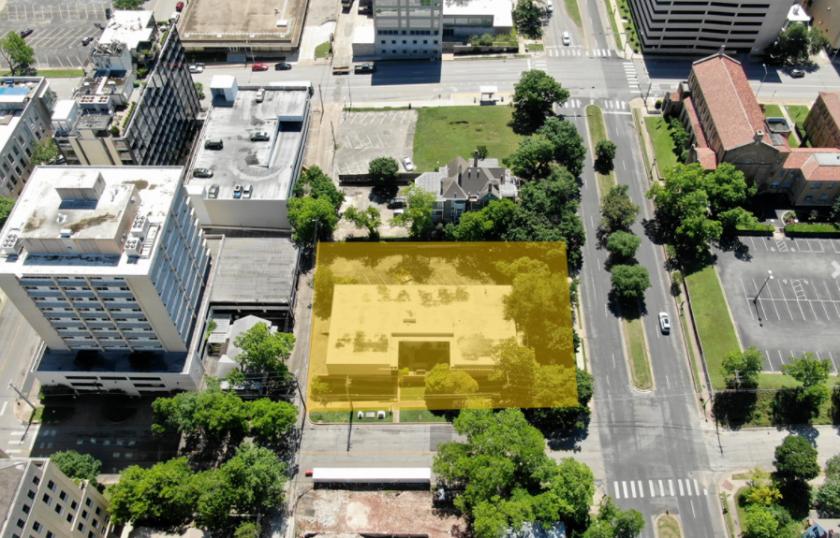
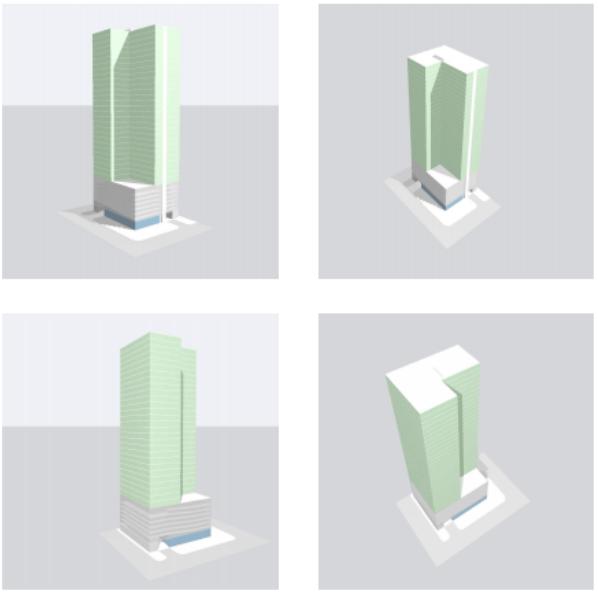
Additional Photos
Listing Agents

Paul Byars
O: 512-694-0878
paul@sayersadvisors.com
O: 512-694-0878
paul@sayersadvisors.com
While we strive to provide the most accurate information, all listing information, and demographic data, is provided by third-parties. As such, MyEListing will not be responsible for the accuracy of the information. It is strongly recommended that you verify all information with the listing agent, and any relevant agencies, prior to making any decisions.


