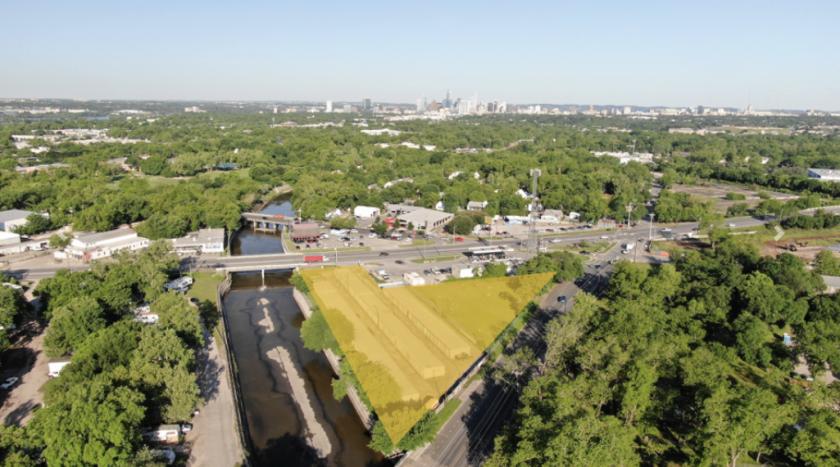
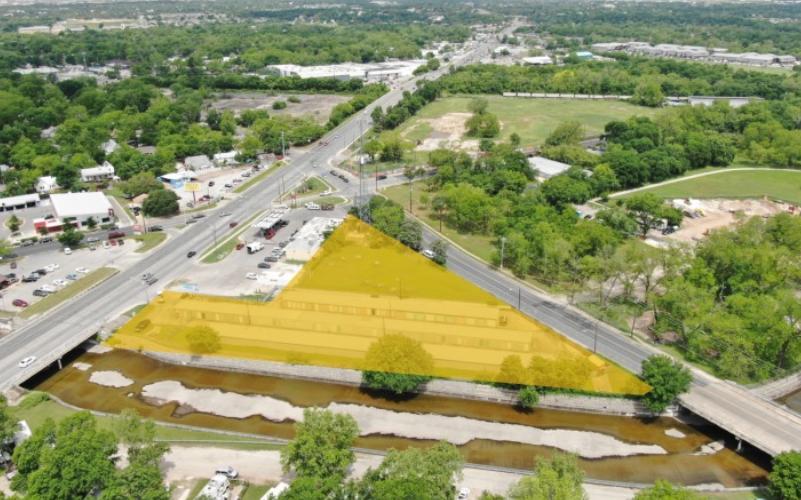
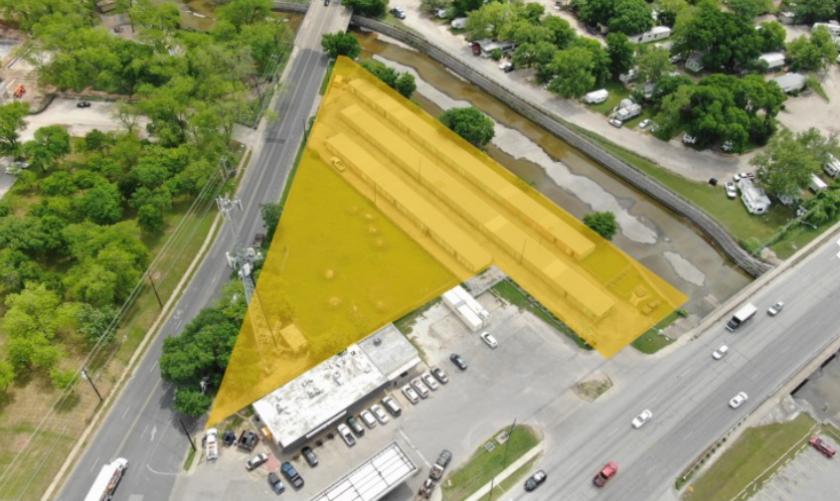
1-Mile | 3-Miles | 5-Miles | ||
---|---|---|---|---|
Total Population | 9,371 | 106,570 | 289,119 | |
Population Median Age | 37 | 34 | 33 | |
Population by Age | 0-9 Yrs | 868 (9%) | 10567 (9%) | 28296 (9%) |
10-19 Yrs | 1107 (11%) | 9058 (8%) | 33732 (11%) | |
20-29 Yrs | 1739 (18%) | 30931 (29%) | 81833 (28%) | |
30-39 Yrs | 1915 (20%) | 22108 (20%) | 56799 (19%) | |
40-49 Yrs | 1296 (13%) | 12515 (11%) | 32647 (11%) | |
50-59 Yrs | 910 (9%) | 9410 (8%) | 25151 (8%) | |
60-69 Yrs | 815 (8%) | 6617 (6%) | 18160 (6%) | |
70+ Yrs | 722 (7%) | 5363 (5%) | 12501 (4%) | |
Median HH Income | $51,090 | $58,166 | $59,579 | |
Total Household Income | < 24K | 895 (26%) | 10049 (23%) | 26333 (22%) |
25-49K | 772 (22%) | 9145 (21%) | 23605 (20%) | |
50-74K | 539 (15%) | 7067 (16%) | 18619 (16%) | |
75-99K | 300 (8%) | 4345 (9%) | 12155 (10%) | |
100-199K | 663 (19%) | 9622 (22%) | 23504 (20%) | |
200K+ | 222 (6%) | 3308 (7%) | 10919 (9%) | |
Highest Education Level | No Diploma | 1762 | 12482 | 26721 |
Diploma or GED | 1199 | 12440 | 29510 | |
Some College | 1184 | 12027 | 28905 | |
Assoc. Degree | 186 | 3114 | 7474 | |
Bachelors Degree | 1485 | 21814 | 60127 | |
Higher Degree | 840 | 11916 | 34575 | |
Total Housing Units | 3,793 | 49,139 | 130,420 | |
--Owner-Occupied | 1,863 | 14,714 | 40,190 | |
--Renter-Occupied | 1,529 | 28,823 | 74,944 | |
Owner-Occupied Values | < 100K | 95 | 1324 | 3272 |
100-199K | 287 | 2066 | 5200 | |
200-299K | 635 | 2798 | 6951 | |
300-399K | 433 | 3137 | 7432 | |
400-499K | 259 | 2227 | 5289 | |
500K+ | 154 | 3163 | 12046 | |
Total Working Age Population | 7,807 | 91,110 | 247,126 | |
In Work Force | 5,353 | 69,033 | 176,382 | |
Not In Work Force | 2,455 | 22,076 | 70,744 | |
Workforce Employed | 5,053 | 66,121 | 168,824 | |
Workforce Unemployed | 299 | 2,877 | 7,456 | |
Civlian Workforce | 5,353 | 68,999 | 176,280 | |
Military Workforce | 0 | 35 | 102 | |
Total Households | 3,392 | 43,537 | 115,134 | |
Family Households | 1,909 | 17,831 | 46,569 | |
Non-Family Households | 1,483 | 25,707 | 68,565 | |
Married Couple | 1,055 | 11,067 | 31,080 | |
Other Family | 855 | 6,764 | 15,489 | |
Married w/Child | 413 | 3,958 | 12,240 | |
Single Male w/Child | 69 | 530 | 1,523 | |
Single Female w/Child | 268 | 2,515 | 6,166 |
Population Change Last Two Decades - Plus Projection
2000 | % | 2010 | % | 2020 | % | 2030 | |
---|---|---|---|---|---|---|---|
Texas | 20,851,820 | +21 | 25,145,561 | +18 | 29,677,668 | +18 | 34,894,452 |
Bastrop County | 57,733 | +28 | 74,171 | +16 | 86,105 | +15 | 99,211 |
Hays County | 97,589 | +61 | 157,107 | +50 | 234,896 | +48 | 347,120 |
Travis County | 812,280 | +26 | 1,024,266 | +26 | 1,291,502 | +19 | 1,540,812 |
Total Working Age Population:
Total Households:
Total Working Age Population:
Total Households:
Total Working Age Population:
Total Households: