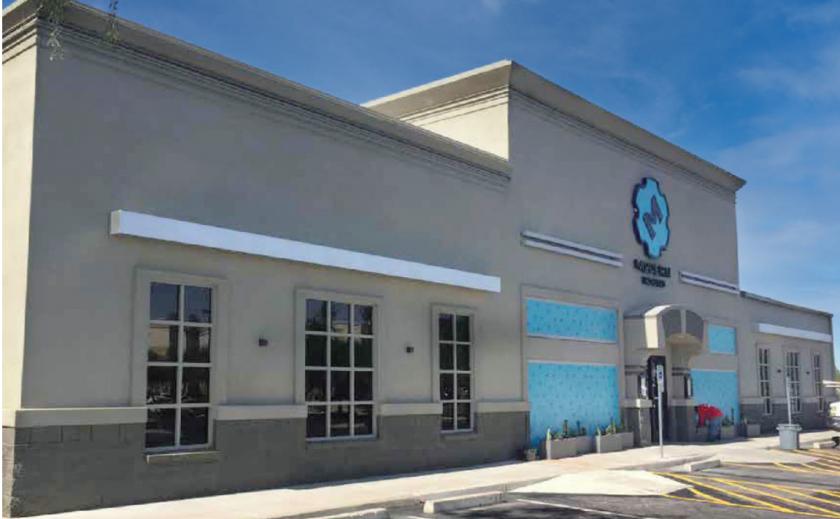
1-Mile | 3-Miles | 5-Miles | ||
---|---|---|---|---|
Total Population | 10,163 | 102,432 | 291,111 | |
Population Median Age | 40 | 47 | 44 | |
Population by Age | 0-9 Yrs | 1314 (12%) | 9156 (8%) | 29918 (10%) |
10-19 Yrs | 1129 (11%) | 9805 (9%) | 33352 (11%) | |
20-29 Yrs | 1279 (12%) | 11914 (11%) | 34147 (11%) | |
30-39 Yrs | 1132 (11%) | 10022 (9%) | 31606 (10%) | |
40-49 Yrs | 1421 (13%) | 10979 (10%) | 33044 (11%) | |
50-59 Yrs | 1371 (13%) | 12886 (12%) | 38295 (13%) | |
60-69 Yrs | 1217 (11%) | 14635 (14%) | 38725 (13%) | |
70+ Yrs | 1300 (12%) | 23034 (22%) | 52025 (17%) | |
Median HH Income | $75,208 | $62,321 | $61,480 | |
Total Household Income | < 24K | 609 (15%) | 7071 (16%) | 19550 (17%) |
25-49K | 733 (18%) | 9976 (23%) | 26216 (23%) | |
50-74K | 661 (16%) | 8123 (18%) | 21674 (19%) | |
75-99K | 629 (15%) | 6394 (14%) | 16672 (14%) | |
100-199K | 1161 (28%) | 9217 (21%) | 24683 (21%) | |
200K+ | 223 (5%) | 2007 (4%) | 4676 (4%) | |
Highest Education Level | No Diploma | 360 | 4977 | 17664 |
Diploma or GED | 1840 | 21440 | 58822 | |
Some College | 1912 | 20851 | 56470 | |
Assoc. Degree | 660 | 7609 | 20825 | |
Bachelors Degree | 1649 | 15349 | 38059 | |
Higher Degree | 702 | 7895 | 20275 | |
Total Housing Units | 4,466 | 49,192 | 127,722 | |
--Owner-Occupied | 2,220 | 29,952 | 80,934 | |
--Renter-Occupied | 1,794 | 12,837 | 32,536 | |
Owner-Occupied Values | < 100K | 43 | 2215 | 9292 |
100-199K | 355 | 9383 | 26118 | |
200-299K | 1082 | 10958 | 26539 | |
300-399K | 577 | 4836 | 11894 | |
400-499K | 147 | 1685 | 4037 | |
500K+ | 16 | 875 | 3054 | |
Total Working Age Population | 8,224 | 87,448 | 241,167 | |
In Work Force | 5,415 | 47,374 | 137,124 | |
Not In Work Force | 2,809 | 40,074 | 104,043 | |
Workforce Employed | 5,118 | 45,113 | 129,880 | |
Workforce Unemployed | 271 | 2,106 | 6,944 | |
Civlian Workforce | 5,389 | 47,219 | 136,824 | |
Military Workforce | 26 | 155 | 300 | |
Total Households | 4,014 | 42,789 | 113,470 | |
Family Households | 2,414 | 26,381 | 73,489 | |
Non-Family Households | 1,600 | 16,408 | 39,981 | |
Married Couple | 1,745 | 20,608 | 55,595 | |
Other Family | 669 | 5,773 | 17,894 | |
Married w/Child | 761 | 5,578 | 16,818 | |
Single Male w/Child | 211 | 865 | 2,611 | |
Single Female w/Child | 178 | 1,550 | 5,740 |
Population Change Last Two Decades - Plus Projection
2000 | % | 2010 | % | 2020 | % | 2030 | |
---|---|---|---|---|---|---|---|
Arizona | 5,130,632 | +25 | 6,392,017 | +14 | 7,286,100 | +14 | 8,284,900 |
Maricopa County | 3,072,149 | +24 | 3,817,117 | +16 | 4,436,900 | +15 | 5,107,700 |
Total Working Age Population:
Total Households:
Total Working Age Population:
Total Households:
Total Working Age Population:
Total Households: