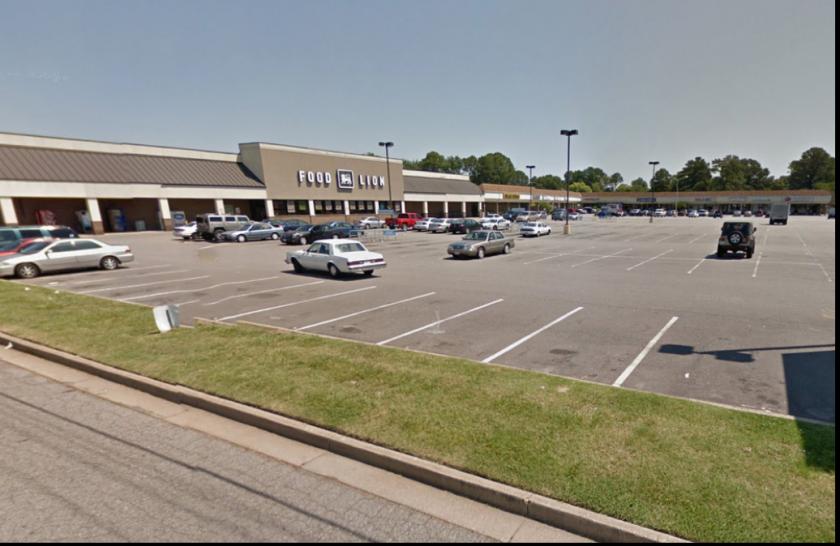
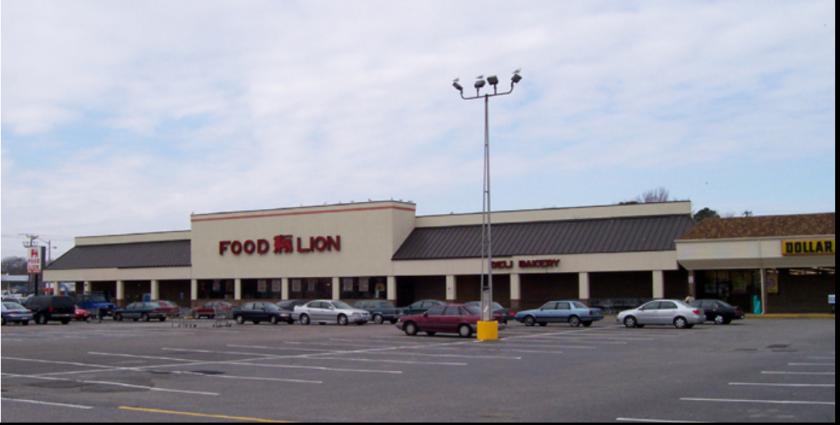
1-Mile | 3-Miles | 5-Miles | ||
---|---|---|---|---|
Total Population | 14,728 | 113,983 | 299,938 | |
Population Median Age | 36 | 37 | 36 | |
Population by Age | 0-9 Yrs | 1804 (12%) | 14349 (12%) | 37336 (12%) |
10-19 Yrs | 1867 (12%) | 12037 (10%) | 34212 (11%) | |
20-29 Yrs | 2812 (19%) | 20748 (18%) | 65744 (21%) | |
30-39 Yrs | 2197 (14%) | 17323 (15%) | 44855 (14%) | |
40-49 Yrs | 1721 (11%) | 13128 (11%) | 31613 (10%) | |
50-59 Yrs | 1786 (12%) | 14959 (13%) | 34934 (11%) | |
60-69 Yrs | 1437 (9%) | 11999 (10%) | 28373 (9%) | |
70+ Yrs | 1106 (7%) | 9439 (8%) | 22872 (7%) | |
Median HH Income | $53,751 | $55,030 | $55,929 | |
Total Household Income | < 24K | 1198 (21%) | 9198 (20%) | 24178 (21%) |
25-49K | 1313 (23%) | 10751 (24%) | 26351 (23%) | |
50-74K | 1436 (25%) | 9715 (21%) | 22483 (19%) | |
75-99K | 563 (10%) | 5900 (13%) | 14695 (13%) | |
100-199K | 930 (16%) | 7393 (16%) | 20357 (18%) | |
200K+ | 118 (2%) | 1507 (3%) | 4946 (4%) | |
Highest Education Level | No Diploma | 1501 | 10279 | 21576 |
Diploma or GED | 2564 | 22740 | 48762 | |
Some College | 2291 | 19702 | 48905 | |
Assoc. Degree | 949 | 7406 | 17354 | |
Bachelors Degree | 1580 | 12254 | 35283 | |
Higher Degree | 636 | 6255 | 23028 | |
Total Housing Units | 6,111 | 48,615 | 124,028 | |
--Owner-Occupied | 2,461 | 22,801 | 54,294 | |
--Renter-Occupied | 3,097 | 21,663 | 58,717 | |
Owner-Occupied Values | < 100K | 134 | 1565 | 3268 |
100-199K | 1099 | 10495 | 20127 | |
200-299K | 955 | 6943 | 16895 | |
300-399K | 169 | 1816 | 6565 | |
400-499K | 26 | 926 | 3231 | |
500K+ | 77 | 1057 | 4208 | |
Total Working Age Population | 11,680 | 91,840 | 244,442 | |
In Work Force | 7,770 | 63,300 | 169,234 | |
Not In Work Force | 3,910 | 28,540 | 75,208 | |
Workforce Employed | 6,773 | 54,385 | 137,451 | |
Workforce Unemployed | 446 | 3,884 | 9,927 | |
Civlian Workforce | 7,219 | 58,269 | 147,377 | |
Military Workforce | 551 | 5,030 | 21,857 | |
Total Households | 5,558 | 44,464 | 113,011 | |
Family Households | 3,599 | 27,496 | 66,933 | |
Non-Family Households | 1,959 | 16,968 | 46,078 | |
Married Couple | 2,122 | 17,599 | 42,786 | |
Other Family | 1,477 | 9,897 | 24,147 | |
Married w/Child | 681 | 6,551 | 17,043 | |
Single Male w/Child | 202 | 1,153 | 2,751 | |
Single Female w/Child | 597 | 3,832 | 10,493 |
Population Change Last Two Decades - Plus Projection
2000 | % | 2010 | % | 2020 | % | 2030 | |
---|---|---|---|---|---|---|---|
Virginia | 7,078,515 | +13 | 8,001,024 | +8 | 8,655,021 | +8 | 9,331,666 |
Chesapeake city | 199,184 | +12 | 222,209 | +12 | 249,244 | +9 | 270,506 |
Hampton city | 146,437 | -6 | 137,436 | -1 | 135,530 | -6 | 127,842 |
Norfolk city | 234,403 | +4 | 242,803 | +2 | 246,881 | +1 | 249,889 |
Portsmouth city | 100,565 | -5 | 95,535 | -1 | 95,027 | -5 | 90,715 |
Virginia Beach city | 425,257 | +3 | 437,994 | +4 | 457,699 | +2 | 467,187 |
Total Working Age Population:
Total Households:
Total Working Age Population:
Total Households:
Total Working Age Population:
Total Households: