Industrial Properties
2712 Nevada Avenue Norfolk, VA 23513
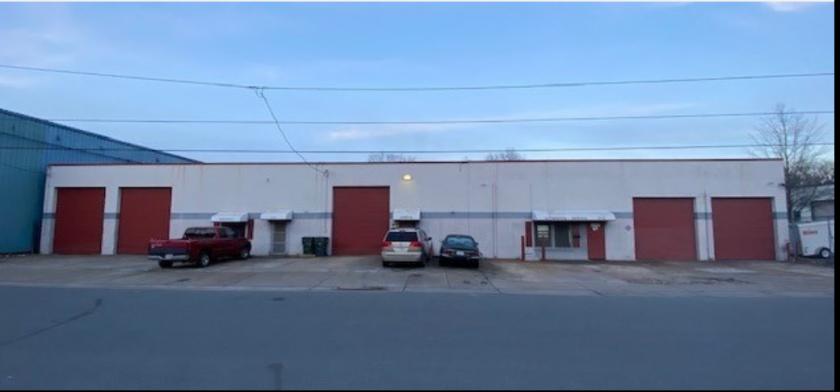
2712 Nevada Avenue Norfolk, VA 23513
Details & Description
Property Highlights
- • Three phase power
- • I-2 Industrial Zoning
- • Located in Norfolk Enterprise Zone
Listing Agents

Brian Baker
O: 757-448-8120
brian@katsias.com
O: 757-448-8120
brian@katsias.com
While we strive to provide the most accurate information, all listing information, and demographic data, is provided by third-parties. As such, MyEListing will not be responsible for the accuracy of the information. It is strongly recommended that you verify all information with the listing agent, and any relevant agencies, prior to making any decisions.


