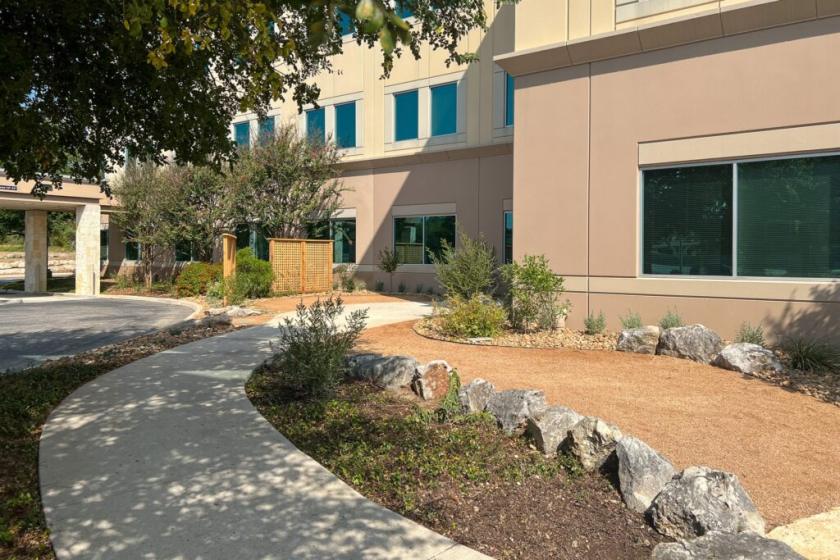
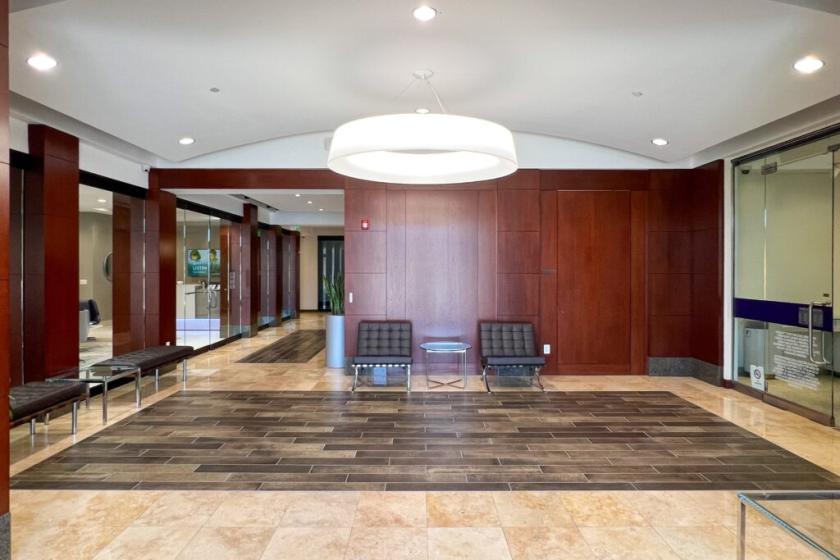
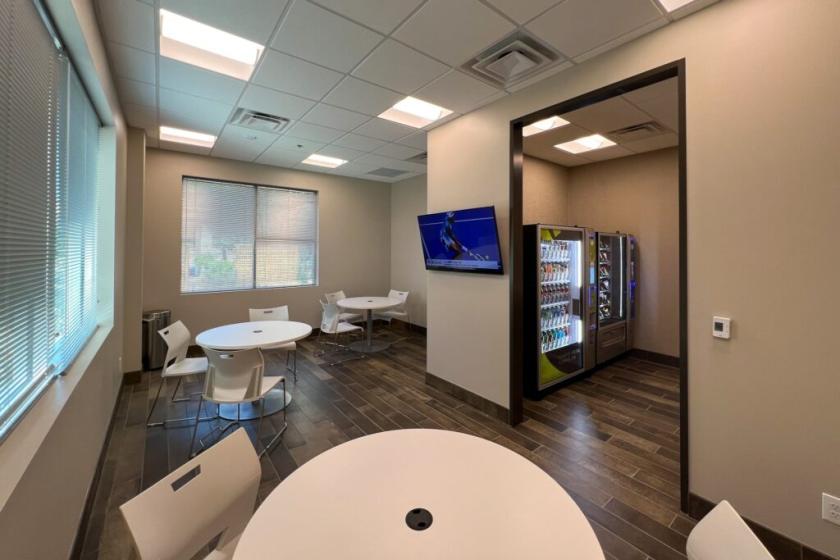
1-Mile | 3-Miles | 5-Miles | ||
---|---|---|---|---|
Total Population | 8,642 | 61,482 | 195,468 | |
Population Median Age | 40 | 40 | 38 | |
Population by Age | 0-9 Yrs | 1094 (12%) | 7486 (12%) | 22762 (11%) |
10-19 Yrs | 1289 (14%) | 7946 (12%) | 24283 (12%) | |
20-29 Yrs | 644 (7%) | 6812 (11%) | 32835 (16%) | |
30-39 Yrs | 929 (10%) | 7566 (12%) | 28659 (14%) | |
40-49 Yrs | 1177 (13%) | 8619 (14%) | 25220 (12%) | |
50-59 Yrs | 1321 (15%) | 8382 (13%) | 23397 (11%) | |
60-69 Yrs | 1322 (15%) | 7636 (12%) | 19751 (10%) | |
70+ Yrs | 867 (10%) | 7035 (11%) | 18562 (9%) | |
Median HH Income | $136,087 | $96,278 | $72,732 | |
Total Household Income | < 24K | 159 (4%) | 2140 (8%) | 10809 (13%) |
25-49K | 359 (10%) | 3879 (15%) | 15620 (19%) | |
50-74K | 303 (9%) | 3343 (13%) | 13809 (17%) | |
75-99K | 346 (10%) | 3374 (13%) | 9805 (12%) | |
100-199K | 1105 (33%) | 7441 (30%) | 19708 (25%) | |
200K+ | 999 (30%) | 4291 (17%) | 8572 (10%) | |
Highest Education Level | No Diploma | 105 | 1297 | 6784 |
Diploma or GED | 461 | 4089 | 18191 | |
Some College | 1048 | 8330 | 29325 | |
Assoc. Degree | 181 | 3076 | 10065 | |
Bachelors Degree | 2132 | 14806 | 42046 | |
Higher Degree | 1948 | 11743 | 27270 | |
Total Housing Units | 3,429 | 26,122 | 84,700 | |
--Owner-Occupied | 2,622 | 16,005 | 40,523 | |
--Renter-Occupied | 648 | 8,462 | 37,800 | |
Owner-Occupied Values | < 100K | 17 | 198 | 1292 |
100-199K | 41 | 807 | 5842 | |
200-299K | 403 | 4944 | 15036 | |
300-399K | 926 | 4872 | 10062 | |
400-499K | 714 | 2255 | 3784 | |
500K+ | 521 | 2928 | 4506 | |
Total Working Age Population | 6,750 | 48,975 | 158,588 | |
In Work Force | 4,363 | 31,918 | 107,848 | |
Not In Work Force | 2,387 | 17,057 | 50,740 | |
Workforce Employed | 4,164 | 30,521 | 103,045 | |
Workforce Unemployed | 165 | 1,030 | 3,995 | |
Civlian Workforce | 4,329 | 31,551 | 107,040 | |
Military Workforce | 34 | 367 | 808 | |
Total Households | 3,271 | 24,467 | 78,322 | |
Family Households | 2,355 | 16,050 | 45,958 | |
Non-Family Households | 916 | 8,416 | 32,365 | |
Married Couple | 2,185 | 13,949 | 36,407 | |
Other Family | 170 | 2,101 | 9,550 | |
Married w/Child | 885 | 5,433 | 14,378 | |
Single Male w/Child | 7 | 189 | 950 | |
Single Female w/Child | 91 | 854 | 3,766 |
Population Change Last Two Decades - Plus Projection
2000 | % | 2010 | % | 2020 | % | 2030 | |
---|---|---|---|---|---|---|---|
Texas | 20,851,820 | +21 | 25,145,561 | +18 | 29,677,668 | +18 | 34,894,452 |
Bexar County | 1,392,931 | +23 | 1,714,773 | +22 | 2,093,502 | +20 | 2,502,617 |
Comal County | 78,021 | +39 | 108,472 | +36 | 147,330 | +39 | 204,873 |
Total Working Age Population:
Total Households:
Total Working Age Population:
Total Households:
Total Working Age Population:
Total Households: