Retail Space
1402 South Parker Road Denver, CO 80231
1402 South Parker Road Denver, CO 80231
Details & Description
Property Highlights
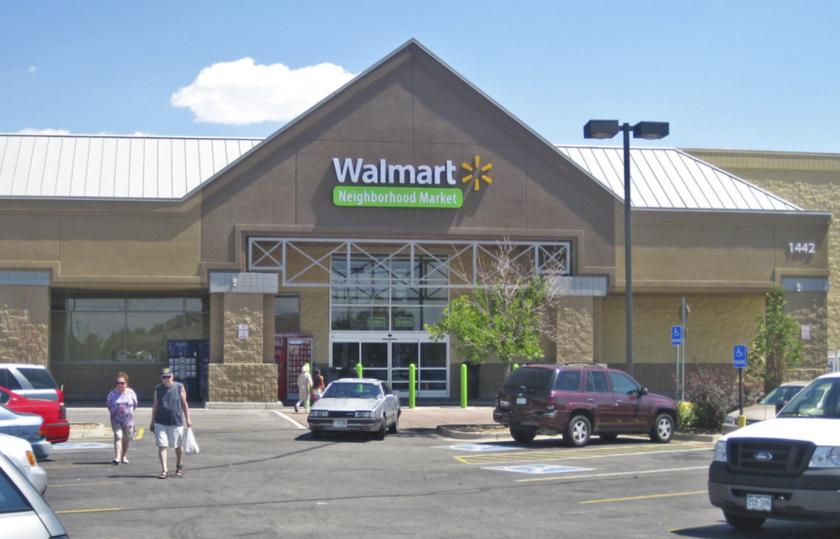
- • Anchored by Walmart.
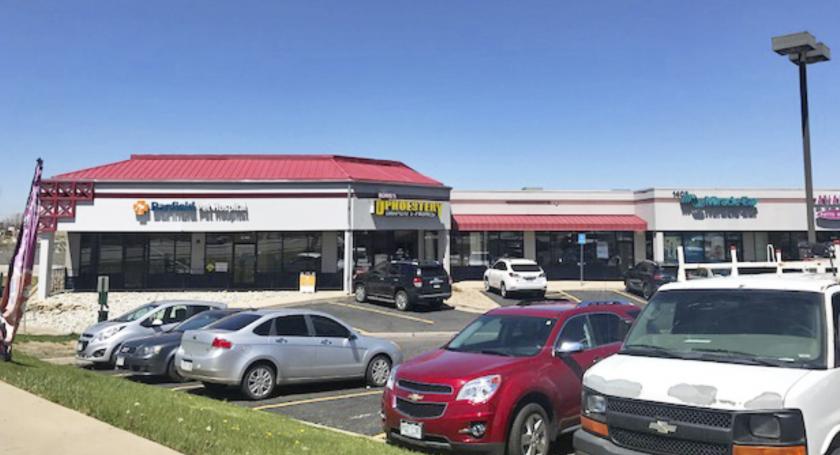
- • Quality mix of tenants.
- • The property is professionally maintained.
Listing Agents

Jim Hoffman
O: 303-390-5238
M: 303-895-8655
jim.hoffman@srsre.com
O: 303-390-5238
M: 303-895-8655
jim.hoffman@srsre.com
While we strive to provide the most accurate information, all listing information, and demographic data, is provided by third-parties. As such, MyEListing will not be responsible for the accuracy of the information. It is strongly recommended that you verify all information with the listing agent, and any relevant agencies, prior to making any decisions.