Retail Space
2648 North Arkansas Avenue Wichita, KS 67204
2648 North Arkansas Avenue Wichita, KS 67204
Details & Description
Property Highlights
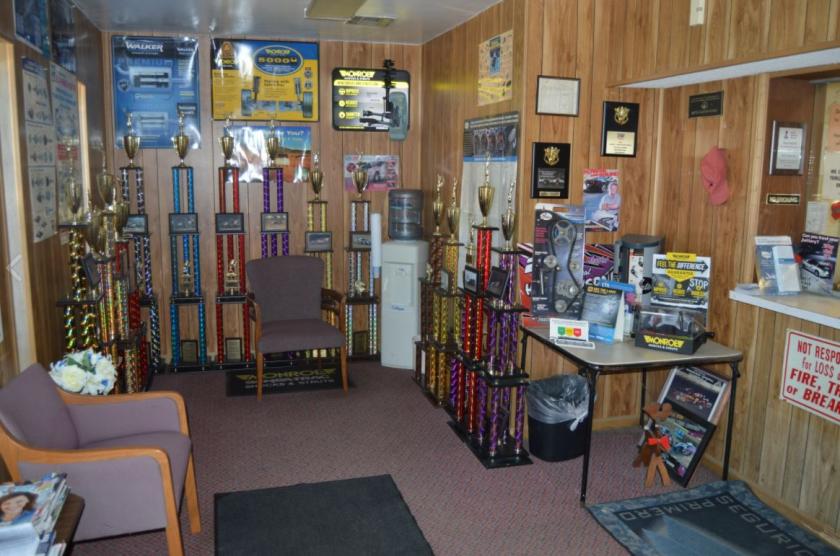
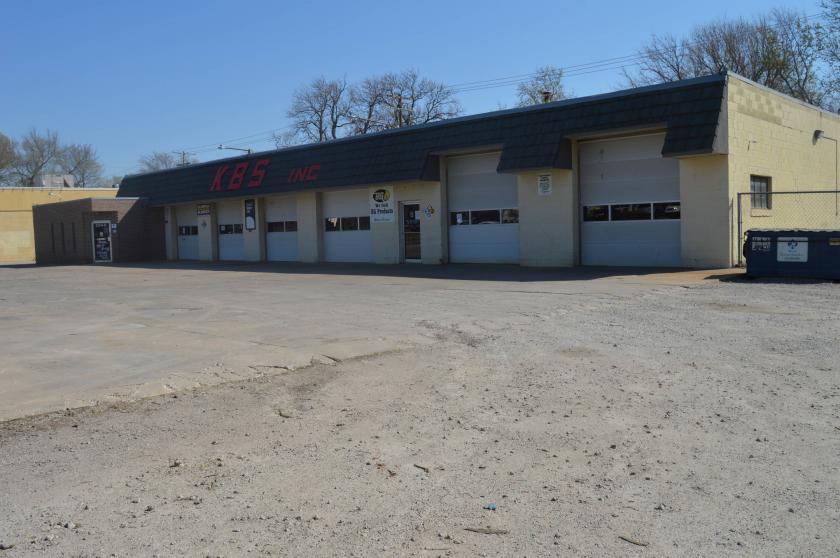
- • Well known Auto repair shop
- • Includes Building, Land and Equipment
- • In business for over 66 years.
Listing Agents

Dave Brown
O: 316-636-2323
M: 316-461-6297
davidb@penfedrealty.com
O: 316-636-2323
M: 316-461-6297
davidb@penfedrealty.com
While we strive to provide the most accurate information, all listing information, and demographic data, is provided by third-parties. As such, MyEListing will not be responsible for the accuracy of the information. It is strongly recommended that you verify all information with the listing agent, and any relevant agencies, prior to making any decisions.