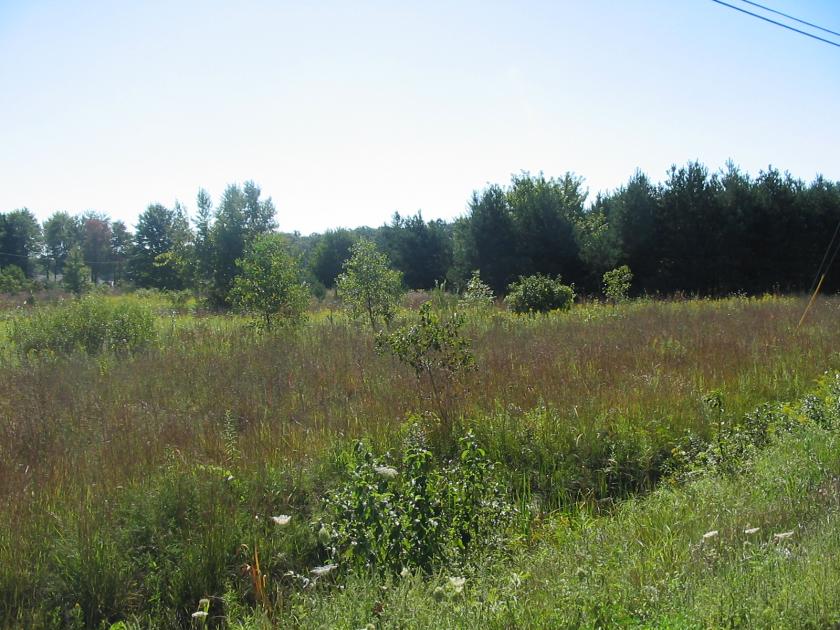
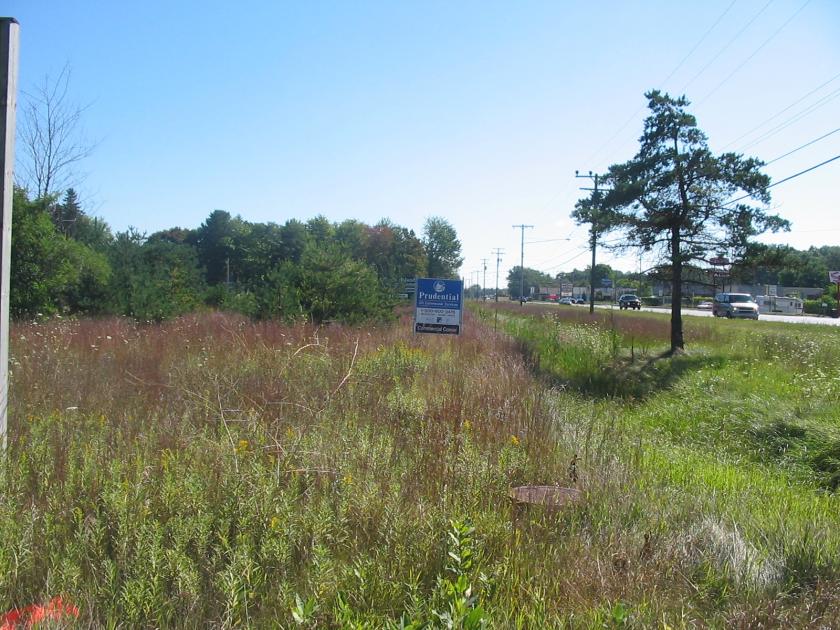
1-Mile | 3-Miles | 5-Miles | ||
---|---|---|---|---|
Total Population | 2,008 | 28,009 | 69,364 | |
Population Median Age | 36 | 38 | 37 | |
Population by Age | 0-9 Yrs | 290 (14%) | 3185 (11%) | 9301 (13%) |
10-19 Yrs | 293 (14%) | 3318 (11%) | 9662 (13%) | |
20-29 Yrs | 264 (13%) | 4758 (16%) | 10580 (15%) | |
30-39 Yrs | 315 (15%) | 3871 (13%) | 9557 (13%) | |
40-49 Yrs | 235 (11%) | 3426 (12%) | 7939 (11%) | |
50-59 Yrs | 230 (11%) | 3587 (12%) | 8512 (12%) | |
60-69 Yrs | 198 (9%) | 3225 (11%) | 7726 (11%) | |
70+ Yrs | 182 (9%) | 2639 (9%) | 6087 (8%) | |
Median HH Income | $48,058 | $43,204 | $39,914 | |
Total Household Income | < 24K | 181 (23%) | 2570 (27%) | 7511 (30%) |
25-49K | 225 (28%) | 2822 (29%) | 7144 (28%) | |
50-74K | 175 (22%) | 2077 (21%) | 4884 (19%) | |
75-99K | 88 (11%) | 1013 (10%) | 2487 (10%) | |
100-199K | 108 (13%) | 921 (9%) | 2354 (9%) | |
200K+ | 1 (0%) | 113 (1%) | 278 (1%) | |
Highest Education Level | No Diploma | 70 | 2218 | 5514 |
Diploma or GED | 674 | 8536 | 18624 | |
Some College | 264 | 4414 | 11257 | |
Assoc. Degree | 185 | 2004 | 4719 | |
Bachelors Degree | 108 | 1463 | 3725 | |
Higher Degree | 24 | 460 | 1237 | |
Total Housing Units | 823 | 10,323 | 27,567 | |
--Owner-Occupied | 596 | 6,826 | 16,536 | |
--Renter-Occupied | 183 | 2,690 | 8,122 | |
Owner-Occupied Values | < 100K | 278 | 4295 | 9821 |
100-199K | 282 | 1972 | 5195 | |
200-299K | 35 | 413 | 1168 | |
300-399K | 0 | 57 | 198 | |
400-499K | 0 | 33 | 63 | |
500K+ | 1 | 55 | 92 | |
Total Working Age Population | 1,551 | 23,125 | 54,390 | |
In Work Force | 1,024 | 11,970 | 30,294 | |
Not In Work Force | 527 | 11,155 | 24,097 | |
Workforce Employed | 895 | 10,999 | 27,630 | |
Workforce Unemployed | 129 | 952 | 2,626 | |
Civlian Workforce | 1,024 | 11,950 | 30,255 | |
Military Workforce | 0 | 20 | 38 | |
Total Households | 779 | 9,515 | 24,658 | |
Family Households | 585 | 5,908 | 15,879 | |
Non-Family Households | 194 | 3,608 | 8,779 | |
Married Couple | 356 | 3,690 | 9,096 | |
Other Family | 229 | 2,218 | 6,784 | |
Married w/Child | 121 | 1,136 | 3,047 | |
Single Male w/Child | 26 | 333 | 974 | |
Single Female w/Child | 141 | 908 | 3,129 |
Population Change Last Two Decades - Plus Projection
2000 | % | 2010 | % | 2020 | % | 2030 | |
---|---|---|---|---|---|---|---|
Michigan | 9,938,444 | -1 | 9,883,640 | +1 | 10,023,423 | +4 | 10,424,510 |
Muskegon County | 170,200 | +1 | 172,188 | +2 | 175,323 | +4 | 182,278 |
Ottawa County | 238,314 | +11 | 263,801 | +12 | 295,791 | +12 | 331,723 |
Total Working Age Population:
Total Households:
Total Working Age Population:
Total Households:
Total Working Age Population:
Total Households: