Commercial Land
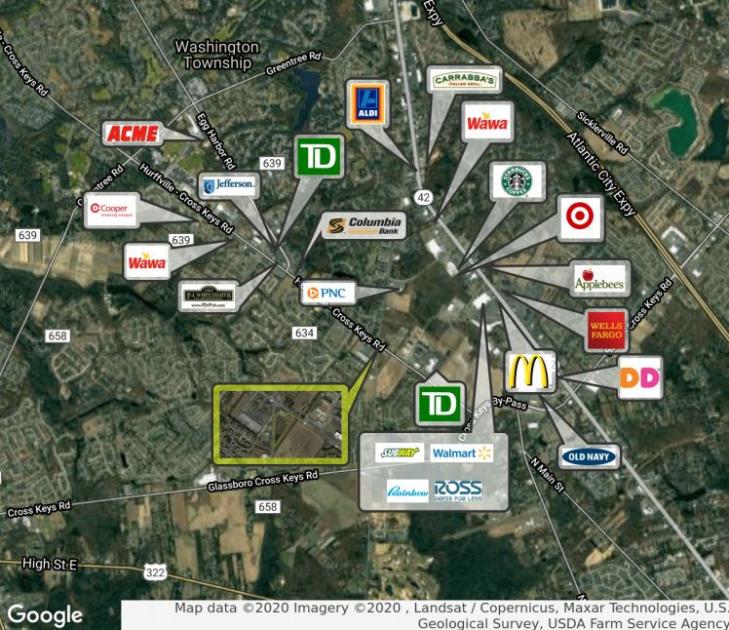
268 Hurffville - Cross Keys Road Washington Township, NJ 08080
268 Hurffville - Cross Keys Road Washington Township, NJ 08080
Details & Description
Property Highlights
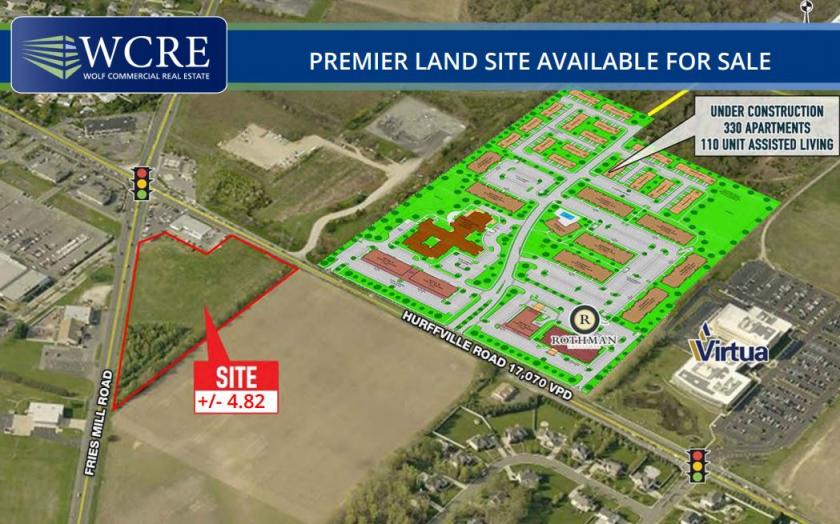
• Potential uses including, but not limited to warehouse, greenhousenursery, recreation, retail, restaurant, office
• Approximately .2 miles from the new Rothman Institute and residential new construction
Listing Agents

Tammi Coppinger
O: 856-857-6303
tammi.coppinger@wolfcre.com
O: 856-857-6303
tammi.coppinger@wolfcre.com
While we strive to provide the most accurate information, all listing information, and demographic data, is provided by third-parties. As such, MyEListing will not be responsible for the accuracy of the information. It is strongly recommended that you verify all information with the listing agent, and any relevant agencies, prior to making any decisions.