Industrial Properties
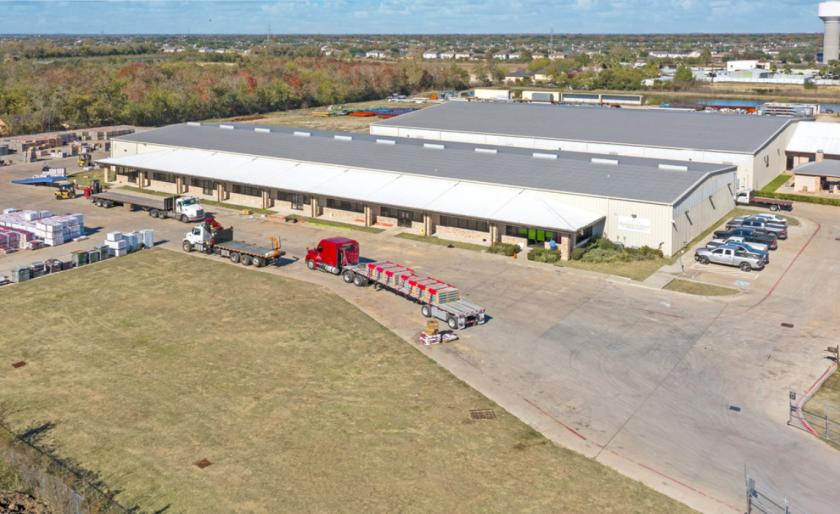
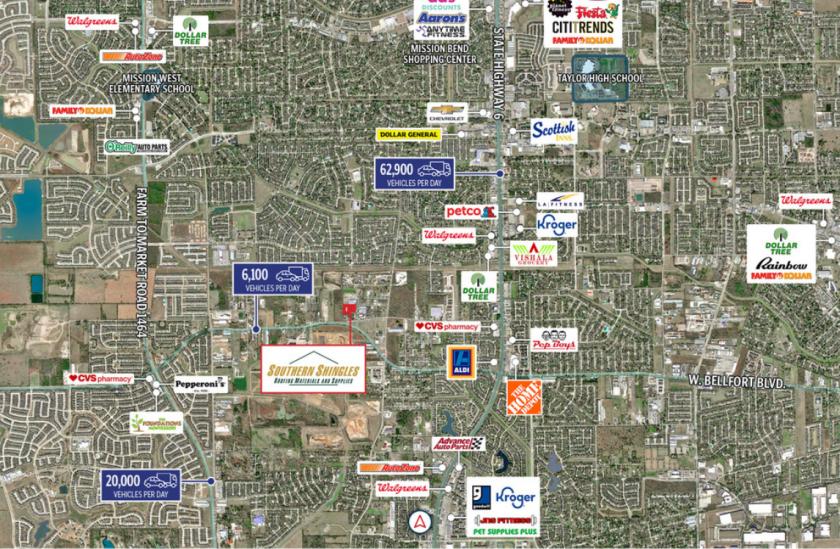
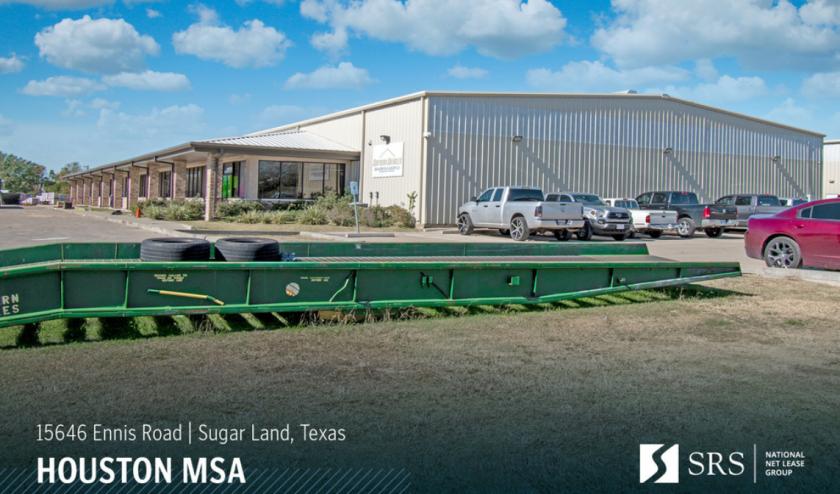
15646 Ennis Road Sugar Land, TX 77498
15646 Ennis Road Sugar Land, TX 77498
Details & Description
Listing Agents

Jack Cornell
O: 801-410-1621
M: 570-762-6075
jack.cornell@srsre.com
O: 801-410-1621
M: 570-762-6075
jack.cornell@srsre.com
While we strive to provide the most accurate information, all listing information, and demographic data, is provided by third-parties. As such, MyEListing will not be responsible for the accuracy of the information. It is strongly recommended that you verify all information with the listing agent, and any relevant agencies, prior to making any decisions.