Retail Space
1431 Cobb Parkway Southeast Marietta, GA 30067
1431 Cobb Parkway Southeast Marietta, GA 30067
Details & Description
Property Highlights
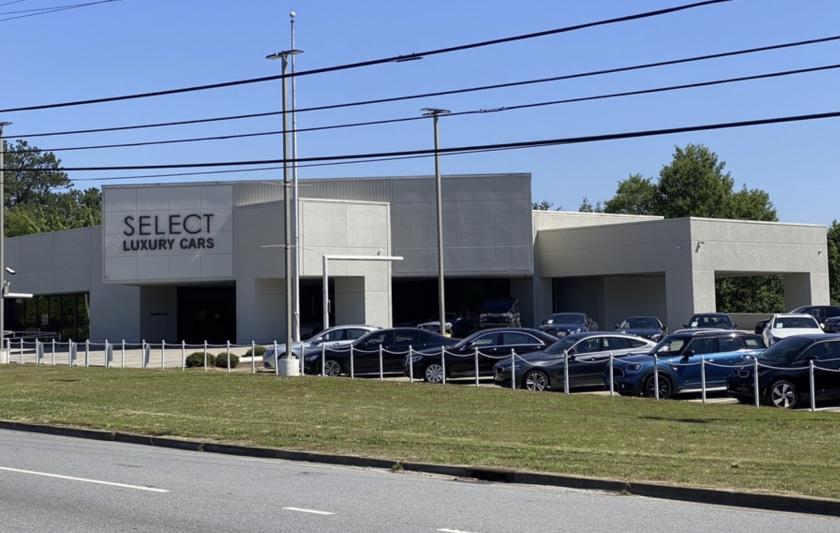
- • Former Infiniti Dealership
- • 20,246 SF on 2 levels
- • Upper 9,221 SF showroom, customer lounge, offices
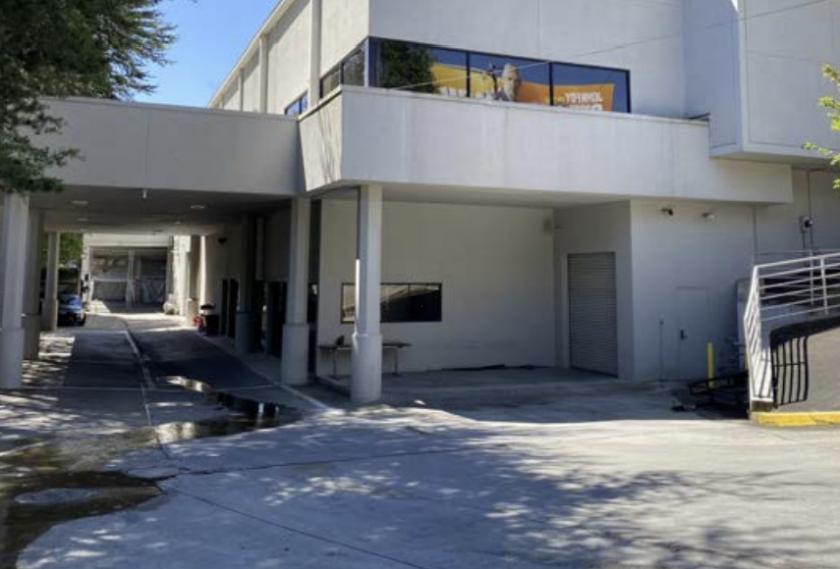
- • Lower 11,025 SF service, offices, parts department
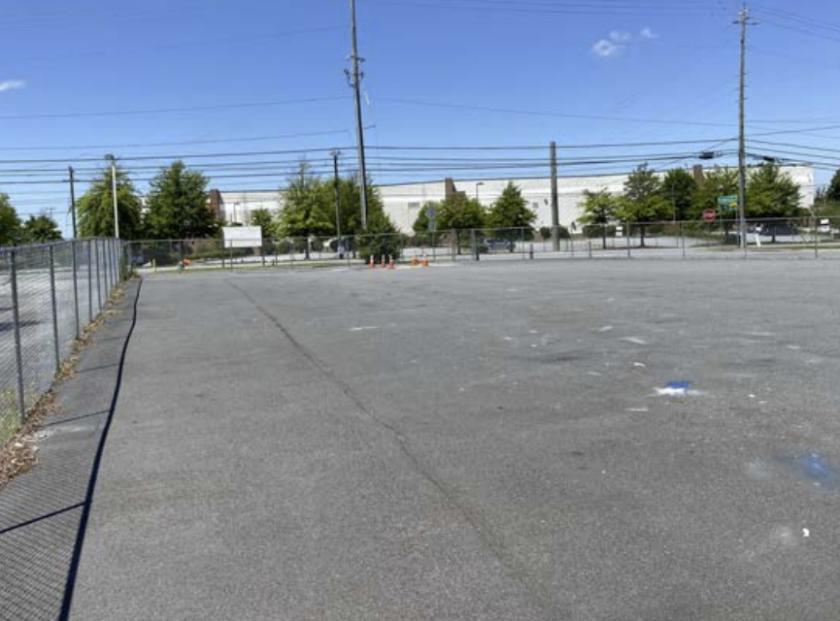
- • Approximately 275 Parking spaces
Listing Agents

Ellen Grisette
O: 678-420-1392
M: 404-861-5188
ellen.grisette@srsre.com
O: 678-420-1392
M: 404-861-5188
ellen.grisette@srsre.com
While we strive to provide the most accurate information, all listing information, and demographic data, is provided by third-parties. As such, MyEListing will not be responsible for the accuracy of the information. It is strongly recommended that you verify all information with the listing agent, and any relevant agencies, prior to making any decisions.