Announcing Southlands newest tenants: Dick's Sporting Goods, Lazy Dog, Bar Louie
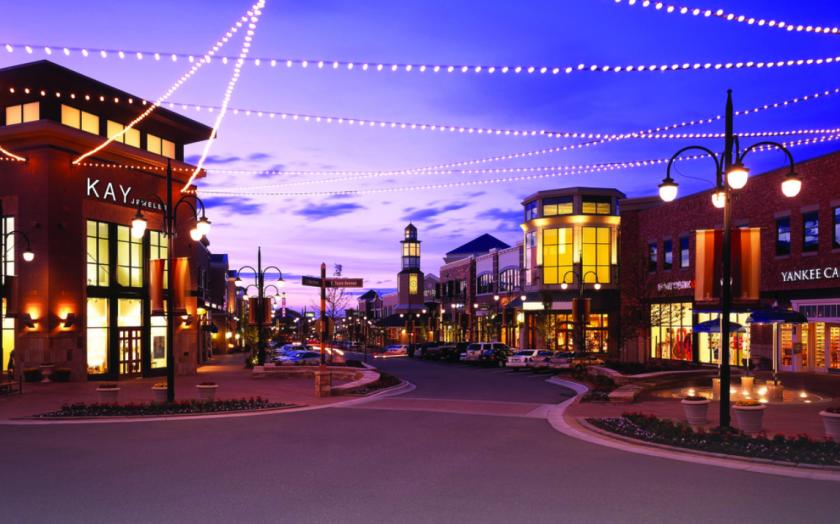
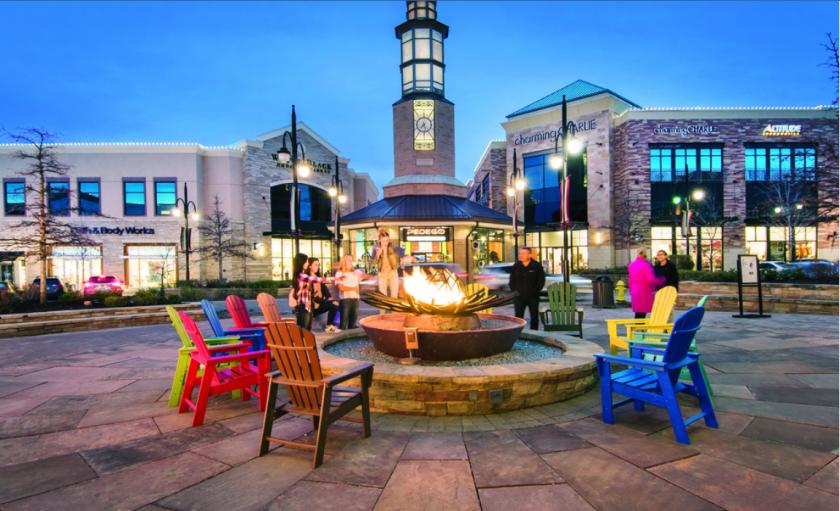
Southeast Aurora’s elite outdoor lifestyle shopping center
Join AMC Theaters, Barnes & Noble, Tru-Fit, H&M and many more successful retailers and restaurants!
1.7 million square feet of retail space
Available Box Space - 29,790 SF (Former Babies“R”Us)
Smaller retail spaces also available ranging from 982 SF - 8,453 SF
High growth market:
300 units multifamily project under construction
140 single family homes plan approved
No part of this information may be copied, reproduced, repurposed, or screen-captured for any commercial purpose without prior written authorization from MyEListing.
While we strive to provide the most accurate information, all listing information, and demographic data, is provided by third-parties. As such, MyEListing will not be responsible for the accuracy of the information. It is strongly recommended that you verify all information with the listing agent, and any relevant agencies, prior to making any decisions.
What is the building size of this commercial Retail property?
The size of this multi-unit property varies between 1142 - 38000 square feet
What kind of Retail is the propery at Southlands?
The property at Southlands Aurora, CO 80016 is listed as a Shopping Center Retail property
What is the population within 1 mile of Southlands in Aurora?
The population within 1 mile of Southlands Aurora, CO 80016 is 12,383 people.
Who do I contact for questions about Southlands?
You should contact the listing agent,
Erik Christopher, for any details regarding this commercial listing.