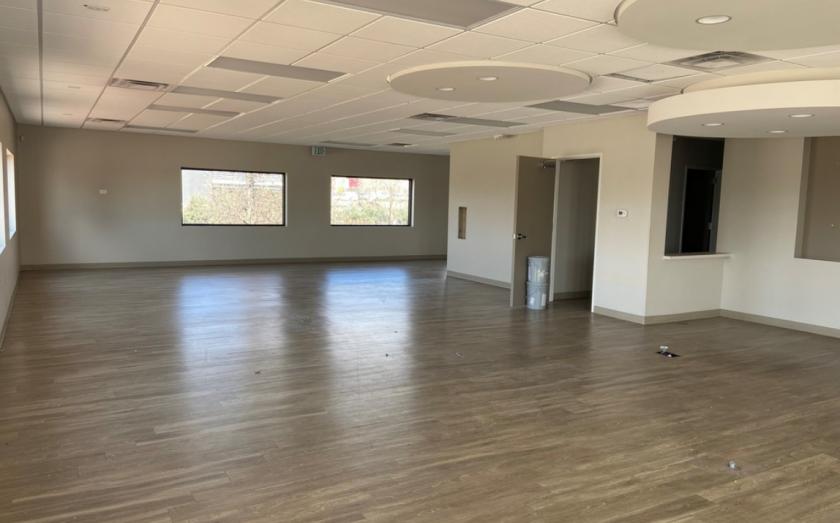
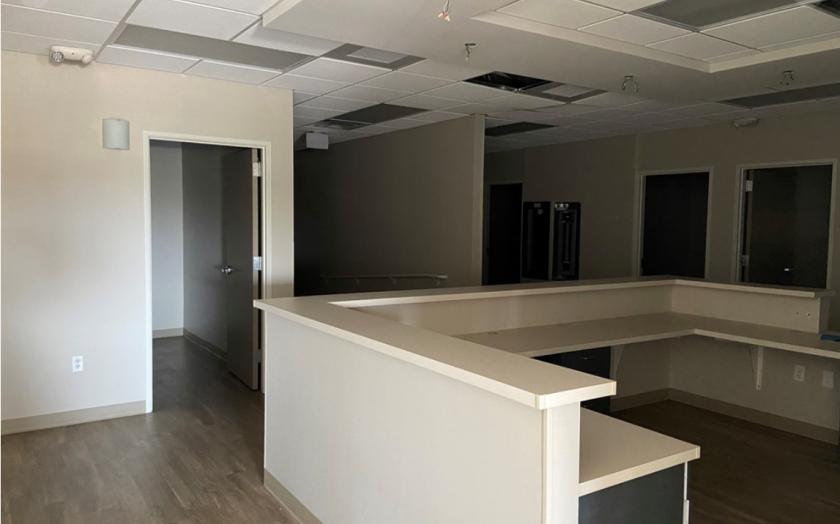
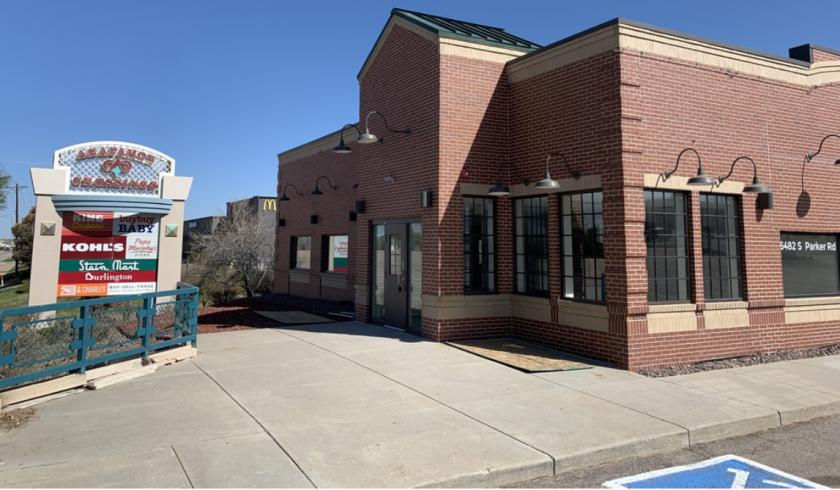
1-Mile | 3-Miles | 5-Miles | ||
---|---|---|---|---|
Total Population | 7,368 | 78,006 | 239,052 | |
Population Median Age | 35 | 36 | 37 | |
Population by Age | 0-9 Yrs | 987 (13%) | 10590 (13%) | 30691 (12%) |
10-19 Yrs | 821 (11%) | 10542 (13%) | 32811 (13%) | |
20-29 Yrs | 1334 (18%) | 9923 (12%) | 31170 (13%) | |
30-39 Yrs | 1206 (16%) | 11455 (14%) | 35545 (14%) | |
40-49 Yrs | 1080 (14%) | 11789 (15%) | 36344 (15%) | |
50-59 Yrs | 999 (13%) | 10818 (13%) | 31454 (13%) | |
60-69 Yrs | 632 (8%) | 8612 (11%) | 24416 (10%) | |
70+ Yrs | 308 (4%) | 4278 (5%) | 16619 (6%) | |
Median HH Income | $90,925 | $100,838 | $91,982 | |
Total Household Income | < 24K | 259 (9%) | 1830 (6%) | 6312 (7%) |
25-49K | 393 (13%) | 3225 (11%) | 12223 (14%) | |
50-74K | 499 (17%) | 4207 (15%) | 15424 (17%) | |
75-99K | 432 (15%) | 4110 (15%) | 14152 (16%) | |
100-199K | 829 (29%) | 9471 (35%) | 28648 (32%) | |
200K+ | 441 (15%) | 4136 (15%) | 10388 (11%) | |
Highest Education Level | No Diploma | 139 | 2158 | 7134 |
Diploma or GED | 729 | 8516 | 27540 | |
Some College | 1137 | 10496 | 33670 | |
Assoc. Degree | 464 | 4642 | 14919 | |
Bachelors Degree | 1649 | 16745 | 49640 | |
Higher Degree | 958 | 9857 | 28500 | |
Total Housing Units | 3,061 | 28,106 | 90,793 | |
--Owner-Occupied | 1,335 | 20,287 | 61,082 | |
--Renter-Occupied | 1,519 | 6,692 | 26,064 | |
Owner-Occupied Values | < 100K | 11 | 232 | 973 |
100-199K | 92 | 1284 | 4354 | |
200-299K | 119 | 3814 | 14107 | |
300-399K | 118 | 5346 | 16330 | |
400-499K | 214 | 4078 | 11084 | |
500K+ | 780 | 5534 | 14234 | |
Total Working Age Population | 5,842 | 60,525 | 187,333 | |
In Work Force | 4,443 | 44,269 | 137,062 | |
Not In Work Force | 1,399 | 16,256 | 50,271 | |
Workforce Employed | 4,283 | 42,479 | 131,842 | |
Workforce Unemployed | 136 | 1,655 | 4,508 | |
Civlian Workforce | 4,419 | 44,134 | 136,350 | |
Military Workforce | 25 | 135 | 712 | |
Total Households | 2,854 | 26,979 | 87,147 | |
Family Households | 1,862 | 20,219 | 61,383 | |
Non-Family Households | 992 | 6,760 | 25,763 | |
Married Couple | 1,491 | 16,592 | 49,221 | |
Other Family | 371 | 3,627 | 12,162 | |
Married w/Child | 735 | 7,583 | 22,840 | |
Single Male w/Child | 61 | 648 | 2,478 | |
Single Female w/Child | 144 | 1,310 | 4,450 |
Population Change Last Two Decades - Plus Projection
2000 | % | 2010 | % | 2020 | % | 2030 | |
---|---|---|---|---|---|---|---|
Colorado | 4,301,261 | +17 | 5,029,196 | +16 | 5,838,181 | +15 | 6,733,658 |
Arapahoe County | 487,967 | +17 | 572,003 | +16 | 662,304 | +13 | 750,773 |
Denver County | 554,636 | +8 | 600,158 | +23 | 738,611 | +12 | 827,681 |
Douglas County | 175,766 | +62 | 285,465 | +23 | 350,161 | +16 | 405,087 |
Total Working Age Population:
Total Households:
Total Working Age Population:
Total Households:
Total Working Age Population:
Total Households: