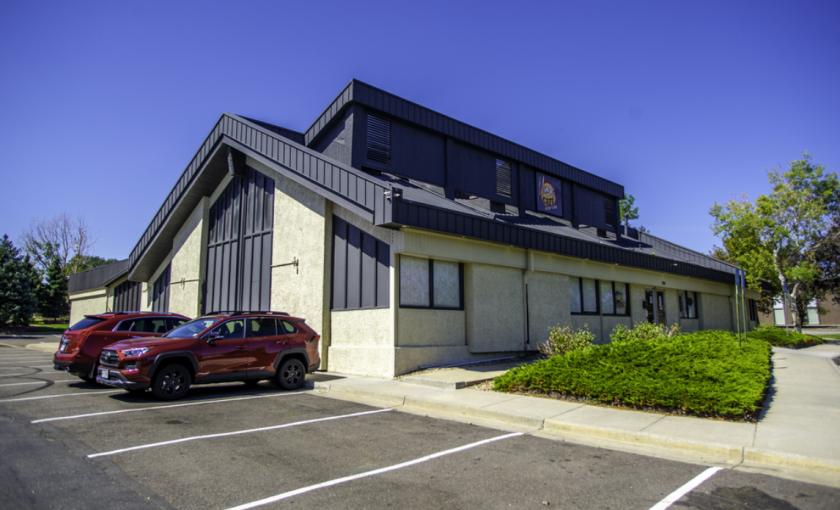
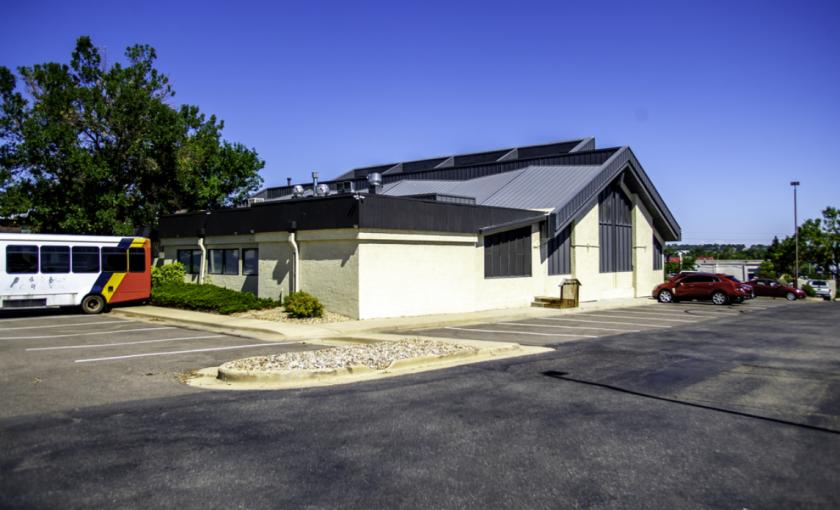
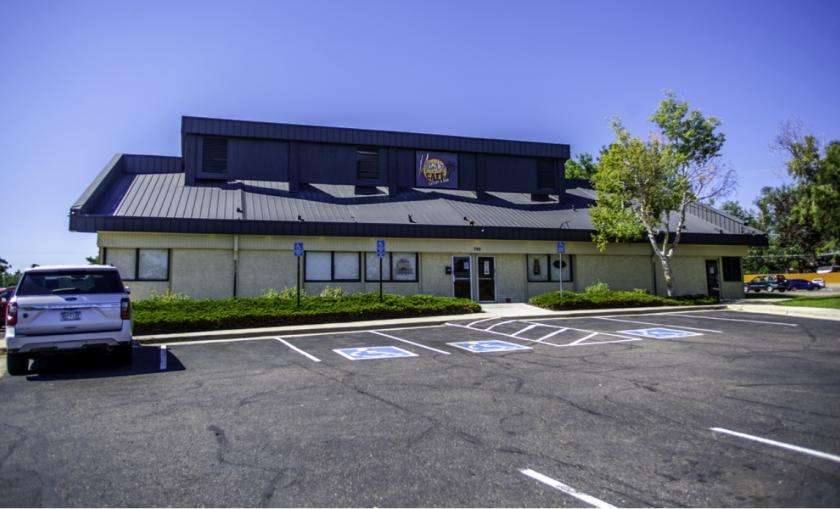
1-Mile | 3-Miles | 5-Miles | ||
---|---|---|---|---|
Total Population | 20,088 | 145,350 | 328,637 | |
Population Median Age | 33 | 35 | 36 | |
Population by Age | 0-9 Yrs | 3095 (15%) | 21233 (14%) | 45671 (13%) |
10-19 Yrs | 3201 (15%) | 20272 (13%) | 44493 (13%) | |
20-29 Yrs | 3316 (16%) | 23772 (16%) | 51838 (15%) | |
30-39 Yrs | 3403 (16%) | 23804 (16%) | 53306 (16%) | |
40-49 Yrs | 2062 (10%) | 17127 (11%) | 39384 (11%) | |
50-59 Yrs | 2311 (11%) | 17199 (11%) | 39400 (11%) | |
60-69 Yrs | 1250 (6%) | 11523 (7%) | 29414 (8%) | |
70+ Yrs | 1451 (7%) | 10418 (7%) | 25132 (7%) | |
Median HH Income | $54,836 | $59,009 | $64,541 | |
Total Household Income | < 24K | 1294 (19%) | 8134 (16%) | 17022 (14%) |
25-49K | 1716 (25%) | 12268 (24%) | 25978 (22%) | |
50-74K | 1621 (23%) | 11103 (22%) | 24027 (20%) | |
75-99K | 952 (14%) | 7378 (14%) | 17651 (15%) | |
100-199K | 1056 (15%) | 9300 (18%) | 25672 (22%) | |
200K+ | 158 (2%) | 1358 (2%) | 4666 (4%) | |
Highest Education Level | No Diploma | 2724 | 20369 | 37781 |
Diploma or GED | 3693 | 28227 | 61580 | |
Some College | 2715 | 20549 | 46968 | |
Assoc. Degree | 1229 | 7670 | 17971 | |
Bachelors Degree | 1569 | 11759 | 34577 | |
Higher Degree | 550 | 4586 | 16317 | |
Total Housing Units | 6,991 | 51,791 | 119,978 | |
--Owner-Occupied | 3,816 | 29,696 | 71,626 | |
--Renter-Occupied | 2,981 | 19,846 | 43,390 | |
Owner-Occupied Values | < 100K | 453 | 4196 | 6760 |
100-199K | 630 | 4784 | 9745 | |
200-299K | 1510 | 10751 | 22811 | |
300-399K | 1035 | 7666 | 20308 | |
400-499K | 118 | 1482 | 6937 | |
500K+ | 70 | 817 | 5065 | |
Total Working Age Population | 15,020 | 111,553 | 256,305 | |
In Work Force | 10,726 | 78,683 | 180,740 | |
Not In Work Force | 4,295 | 32,871 | 75,565 | |
Workforce Employed | 10,217 | 75,621 | 173,365 | |
Workforce Unemployed | 499 | 3,002 | 7,208 | |
Civlian Workforce | 10,716 | 78,624 | 180,573 | |
Military Workforce | 10 | 59 | 167 | |
Total Households | 6,797 | 49,542 | 115,016 | |
Family Households | 4,265 | 32,477 | 75,255 | |
Non-Family Households | 2,532 | 17,065 | 39,761 | |
Married Couple | 2,820 | 20,859 | 51,824 | |
Other Family | 1,445 | 11,618 | 23,430 | |
Married w/Child | 1,272 | 9,621 | 22,591 | |
Single Male w/Child | 182 | 1,873 | 3,511 | |
Single Female w/Child | 765 | 4,151 | 8,417 |
Population Change Last Two Decades - Plus Projection
2000 | % | 2010 | % | 2020 | % | 2030 | |
---|---|---|---|---|---|---|---|
Colorado | 4,301,261 | +17 | 5,029,196 | +16 | 5,838,181 | +15 | 6,733,658 |
Adams County | 363,857 | +21 | 441,603 | +20 | 530,680 | +21 | 642,318 |
Broomfield County | 0 | 55,889 | +32 | 73,822 | +28 | 94,282 | |
Denver County | 554,636 | +8 | 600,158 | +23 | 738,611 | +12 | 827,681 |
Jefferson County | 527,056 | +1 | 534,543 | +10 | 587,118 | +7 | 626,742 |
Total Working Age Population:
Total Households:
Total Working Age Population:
Total Households:
Total Working Age Population:
Total Households: