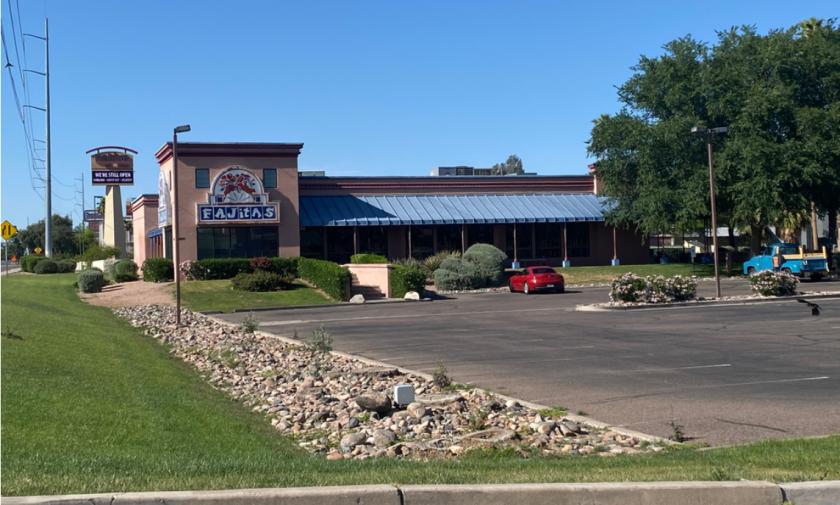
1-Mile | 3-Miles | 5-Miles | ||
---|---|---|---|---|
Total Population | 13,944 | 172,524 | 442,691 | |
Population Median Age | 33 | 36 | 37 | |
Population by Age | 0-9 Yrs | 2411 (17%) | 25947 (15%) | 62708 (14%) |
10-19 Yrs | 1583 (11%) | 21739 (12%) | 57770 (13%) | |
20-29 Yrs | 2713 (19%) | 27970 (16%) | 68222 (15%) | |
30-39 Yrs | 2392 (17%) | 23966 (13%) | 61460 (13%) | |
40-49 Yrs | 1409 (10%) | 21256 (12%) | 55662 (12%) | |
50-59 Yrs | 1455 (10%) | 21390 (12%) | 54725 (12%) | |
60-69 Yrs | 1105 (7%) | 15998 (9%) | 43754 (9%) | |
70+ Yrs | 876 (6%) | 14257 (8%) | 38390 (8%) | |
Median HH Income | $40,085 | $46,822 | $49,840 | |
Total Household Income | < 24K | 1792 (31%) | 15891 (25%) | 39017 (24%) |
25-49K | 1838 (32%) | 16644 (26%) | 41754 (25%) | |
50-74K | 926 (16%) | 12248 (19%) | 30360 (18%) | |
75-99K | 689 (12%) | 7167 (11%) | 18547 (11%) | |
100-199K | 418 (7%) | 7907 (12%) | 24445 (15%) | |
200K+ | 66 (1%) | 1863 (3%) | 6937 (4%) | |
Highest Education Level | No Diploma | 1523 | 18113 | 46943 |
Diploma or GED | 2294 | 32449 | 77961 | |
Some College | 2310 | 27522 | 70702 | |
Assoc. Degree | 798 | 10173 | 24887 | |
Bachelors Degree | 1069 | 15919 | 44132 | |
Higher Degree | 611 | 7555 | 25364 | |
Total Housing Units | 6,725 | 67,767 | 177,177 | |
--Owner-Occupied | 1,485 | 29,607 | 82,883 | |
--Renter-Occupied | 4,243 | 32,114 | 78,178 | |
Owner-Occupied Values | < 100K | 454 | 3408 | 10850 |
100-199K | 665 | 13587 | 30286 | |
200-299K | 262 | 8639 | 23840 | |
300-399K | 33 | 1532 | 7775 | |
400-499K | 0 | 908 | 4157 | |
500K+ | 72 | 1532 | 5975 | |
Total Working Age Population | 10,591 | 133,958 | 345,739 | |
In Work Force | 6,733 | 85,813 | 222,291 | |
Not In Work Force | 3,858 | 48,144 | 123,447 | |
Workforce Employed | 6,232 | 79,421 | 208,245 | |
Workforce Unemployed | 501 | 6,353 | 13,934 | |
Civlian Workforce | 6,733 | 85,774 | 222,179 | |
Military Workforce | 0 | 40 | 112 | |
Total Households | 5,728 | 61,721 | 161,061 | |
Family Households | 3,013 | 37,344 | 97,496 | |
Non-Family Households | 2,715 | 24,377 | 63,565 | |
Married Couple | 1,702 | 22,083 | 59,731 | |
Other Family | 1,312 | 15,261 | 37,765 | |
Married w/Child | 837 | 9,283 | 24,459 | |
Single Male w/Child | 220 | 2,475 | 5,698 | |
Single Female w/Child | 614 | 5,784 | 14,438 |
Population Change Last Two Decades - Plus Projection
2000 | % | 2010 | % | 2020 | % | 2030 | |
---|---|---|---|---|---|---|---|
Arizona | 5,130,632 | +25 | 6,392,017 | +14 | 7,286,100 | +14 | 8,284,900 |
Maricopa County | 3,072,149 | +24 | 3,817,117 | +16 | 4,436,900 | +15 | 5,107,700 |
Total Working Age Population:
Total Households:
Total Working Age Population:
Total Households:
Total Working Age Population:
Total Households: