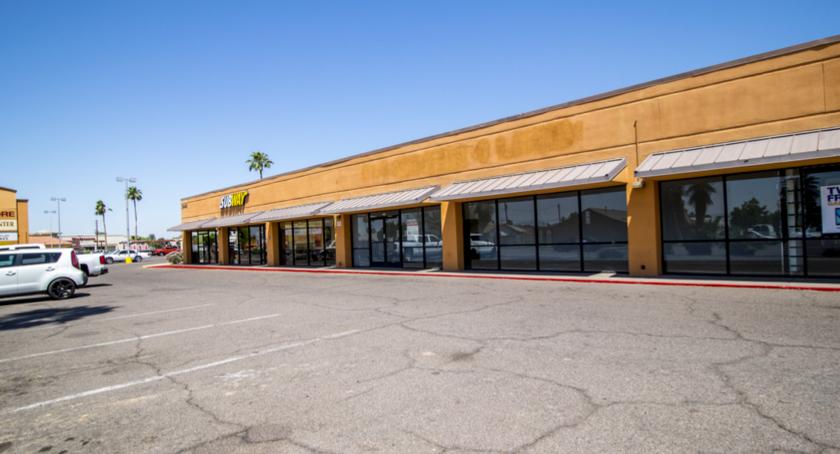
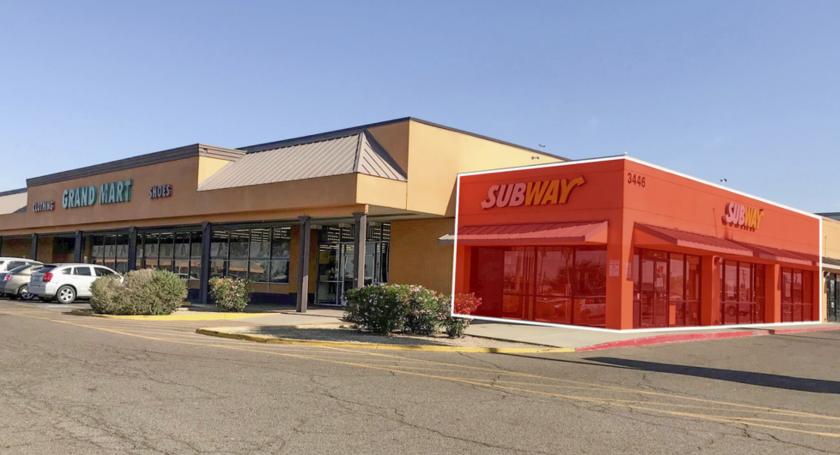
1-Mile | 3-Miles | 5-Miles | ||
---|---|---|---|---|
Total Population | 26,212 | 212,557 | 538,612 | |
Population Median Age | 31 | 32 | 33 | |
Population by Age | 0-9 Yrs | 3936 (15%) | 36741 (17%) | 87858 (16%) |
10-19 Yrs | 5386 (20%) | 35490 (16%) | 84867 (15%) | |
20-29 Yrs | 4396 (16%) | 34673 (16%) | 86770 (16%) | |
30-39 Yrs | 3559 (13%) | 29777 (14%) | 78611 (14%) | |
40-49 Yrs | 3693 (14%) | 26202 (12%) | 67991 (12%) | |
50-59 Yrs | 2369 (9%) | 22227 (10%) | 58383 (10%) | |
60-69 Yrs | 1684 (6%) | 15663 (7%) | 41480 (7%) | |
70+ Yrs | 1189 (4%) | 11785 (5%) | 32652 (6%) | |
Median HH Income | $38,969 | $38,815 | $43,155 | |
Total Household Income | < 24K | 2355 (33%) | 21010 (32%) | 50455 (28%) |
25-49K | 2122 (30%) | 19671 (30%) | 49943 (28%) | |
50-74K | 1309 (18%) | 11684 (17%) | 32034 (18%) | |
75-99K | 594 (8%) | 5797 (8%) | 17057 (9%) | |
100-199K | 576 (8%) | 6132 (9%) | 20691 (11%) | |
200K+ | 57 (0%) | 867 (1%) | 5602 (3%) | |
Highest Education Level | No Diploma | 5614 | 39689 | 90171 |
Diploma or GED | 4190 | 35554 | 89747 | |
Some College | 2712 | 24463 | 64794 | |
Assoc. Degree | 635 | 8183 | 21245 | |
Bachelors Degree | 815 | 10485 | 37340 | |
Higher Degree | 191 | 4678 | 21076 | |
Total Housing Units | 7,844 | 72,738 | 195,485 | |
--Owner-Occupied | 2,886 | 28,695 | 77,387 | |
--Renter-Occupied | 4,127 | 36,465 | 98,394 | |
Owner-Occupied Values | < 100K | 720 | 7430 | 15479 |
100-199K | 1791 | 14295 | 33414 | |
200-299K | 347 | 4880 | 15012 | |
300-399K | 4 | 1331 | 5411 | |
400-499K | 15 | 345 | 2826 | |
500K+ | 9 | 414 | 5244 | |
Total Working Age Population | 19,217 | 154,887 | 399,983 | |
In Work Force | 11,568 | 96,580 | 256,371 | |
Not In Work Force | 7,649 | 58,307 | 143,612 | |
Workforce Employed | 10,930 | 89,369 | 238,700 | |
Workforce Unemployed | 638 | 7,159 | 17,468 | |
Civlian Workforce | 11,568 | 96,528 | 256,168 | |
Military Workforce | 0 | 52 | 203 | |
Total Households | 7,013 | 65,160 | 175,781 | |
Family Households | 5,048 | 42,322 | 108,957 | |
Non-Family Households | 1,965 | 22,838 | 66,824 | |
Married Couple | 2,826 | 23,142 | 61,668 | |
Other Family | 2,222 | 19,180 | 47,289 | |
Married w/Child | 1,682 | 12,303 | 30,954 | |
Single Male w/Child | 389 | 2,908 | 7,891 | |
Single Female w/Child | 787 | 8,461 | 20,115 |
Population Change Last Two Decades - Plus Projection
2000 | % | 2010 | % | 2020 | % | 2030 | |
---|---|---|---|---|---|---|---|
Arizona | 5,130,632 | +25 | 6,392,017 | +14 | 7,286,100 | +14 | 8,284,900 |
Maricopa County | 3,072,149 | +24 | 3,817,117 | +16 | 4,436,900 | +15 | 5,107,700 |
Pinal County | 179,727 | +109 | 375,770 | +24 | 466,200 | +32 | 616,200 |
Total Working Age Population:
Total Households:
Total Working Age Population:
Total Households:
Total Working Age Population:
Total Households: