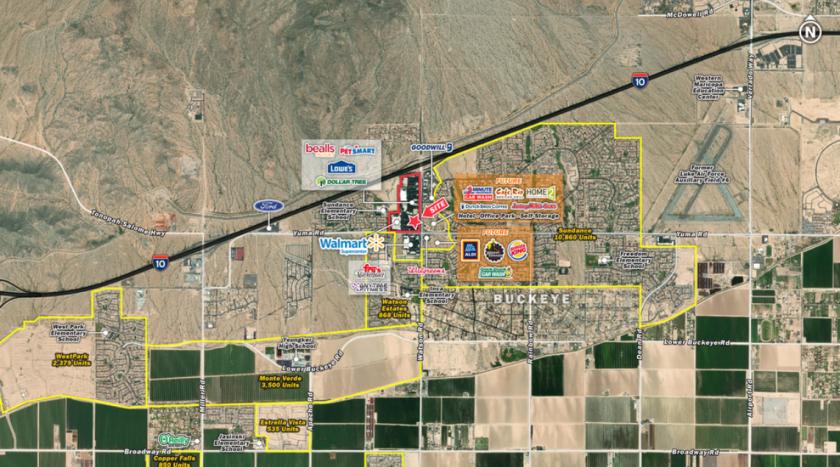
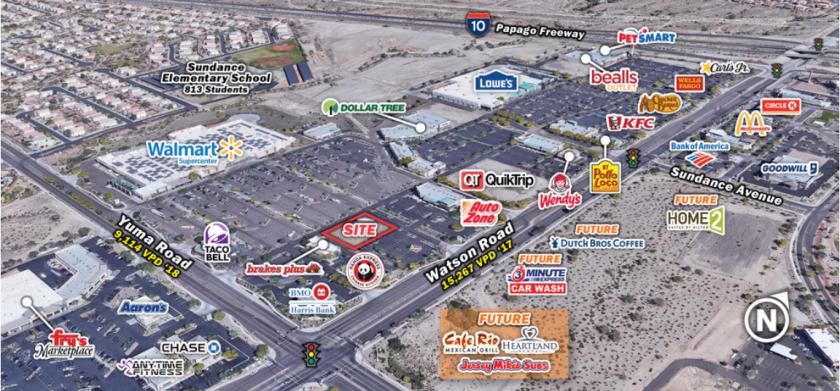
1-Mile | 3-Miles | 5-Miles | ||
---|---|---|---|---|
Total Population | 4,403 | 24,541 | 50,279 | |
Population Median Age | 34 | 33 | 33 | |
Population by Age | 0-9 Yrs | 928 (21%) | 4521 (18%) | 8904 (17%) |
10-19 Yrs | 649 (14%) | 4116 (16%) | 8700 (17%) | |
20-29 Yrs | 526 (11%) | 3319 (13%) | 6508 (12%) | |
30-39 Yrs | 616 (13%) | 3553 (14%) | 7140 (14%) | |
40-49 Yrs | 320 (7%) | 3025 (12%) | 7000 (13%) | |
50-59 Yrs | 539 (12%) | 2477 (10%) | 4922 (9%) | |
60-69 Yrs | 486 (11%) | 2088 (8%) | 4100 (8%) | |
70+ Yrs | 340 (7%) | 1443 (5%) | 3005 (5%) | |
Median HH Income | $66,270 | $67,650 | $68,385 | |
Total Household Income | < 24K | 224 (16%) | 732 (10%) | 1622 (11%) |
25-49K | 230 (17%) | 1362 (19%) | 2810 (19%) | |
50-74K | 342 (25%) | 1943 (27%) | 3604 (25%) | |
75-99K | 213 (16%) | 1228 (17%) | 2482 (17%) | |
100-199K | 266 (20%) | 1434 (20%) | 3283 (22%) | |
200K+ | 52 (3%) | 303 (4%) | 546 (3%) | |
Highest Education Level | No Diploma | 275 | 1839 | 4288 |
Diploma or GED | 795 | 4280 | 8434 | |
Some College | 769 | 4010 | 8215 | |
Assoc. Degree | 206 | 1562 | 3086 | |
Bachelors Degree | 422 | 2238 | 4294 | |
Higher Degree | 136 | 610 | 1423 | |
Total Housing Units | 1,551 | 7,830 | 15,876 | |
--Owner-Occupied | 997 | 5,131 | 10,489 | |
--Renter-Occupied | 330 | 1,870 | 3,859 | |
Owner-Occupied Values | < 100K | 75 | 384 | 802 |
100-199K | 395 | 2232 | 4296 | |
200-299K | 406 | 2026 | 3701 | |
300-399K | 87 | 320 | 940 | |
400-499K | 32 | 92 | 422 | |
500K+ | 2 | 76 | 328 | |
Total Working Age Population | 3,057 | 17,372 | 35,905 | |
In Work Force | 1,893 | 11,992 | 24,043 | |
Not In Work Force | 1,163 | 5,380 | 11,862 | |
Workforce Employed | 1,815 | 11,338 | 22,517 | |
Workforce Unemployed | 73 | 565 | 1,317 | |
Civlian Workforce | 1,889 | 11,903 | 23,834 | |
Military Workforce | 5 | 89 | 209 | |
Total Households | 1,327 | 7,001 | 14,348 | |
Family Households | 1,067 | 5,695 | 11,684 | |
Non-Family Households | 261 | 1,306 | 2,663 | |
Married Couple | 788 | 4,461 | 9,045 | |
Other Family | 278 | 1,234 | 2,639 | |
Married w/Child | 296 | 2,303 | 4,982 | |
Single Male w/Child | 39 | 288 | 583 | |
Single Female w/Child | 143 | 392 | 919 |
Population Change Last Two Decades - Plus Projection
2000 | % | 2010 | % | 2020 | % | 2030 | |
---|---|---|---|---|---|---|---|
Arizona | 5,130,632 | +25 | 6,392,017 | +14 | 7,286,100 | +14 | 8,284,900 |
Maricopa County | 3,072,149 | +24 | 3,817,117 | +16 | 4,436,900 | +15 | 5,107,700 |
Total Working Age Population:
Total Households:
Total Working Age Population:
Total Households:
Total Working Age Population:
Total Households: