Retail Space
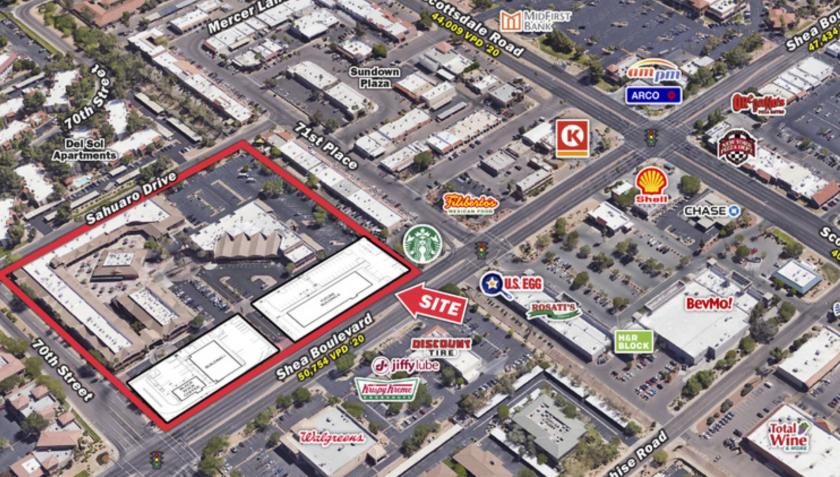
7000 East Shea Boulevard Scottsdale, AZ 85254
7000 East Shea Boulevard Scottsdale, AZ 85254
Details & Description
Property Highlights
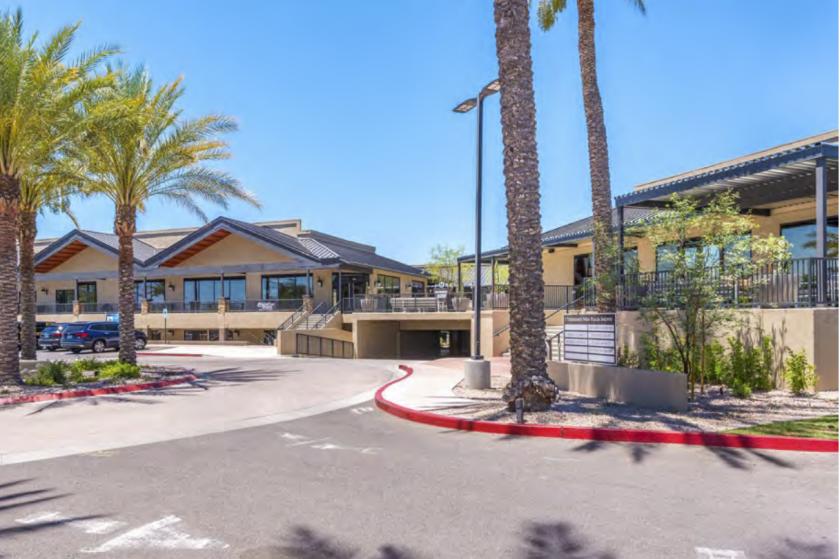
- • 15,476 SF former Tuesday Morning now available
- • Built out barrestaurant space available
- • Ample surface garage parking
- • Over $14 MM invested in property upgrades
Listing Agents

Scott Ellsworth
O: 602-682-6063
M: 602-369-1368
scott.ellsworth@srsre.com
O: 602-682-6063
M: 602-369-1368
scott.ellsworth@srsre.com
While we strive to provide the most accurate information, all listing information, and demographic data, is provided by third-parties. As such, MyEListing will not be responsible for the accuracy of the information. It is strongly recommended that you verify all information with the listing agent, and any relevant agencies, prior to making any decisions.