Unparalleled Access - Located directly on Route 135 16.
Commuter Rail - Wellesley Commuter Rail is minutes away and walking distance to the portfolio.
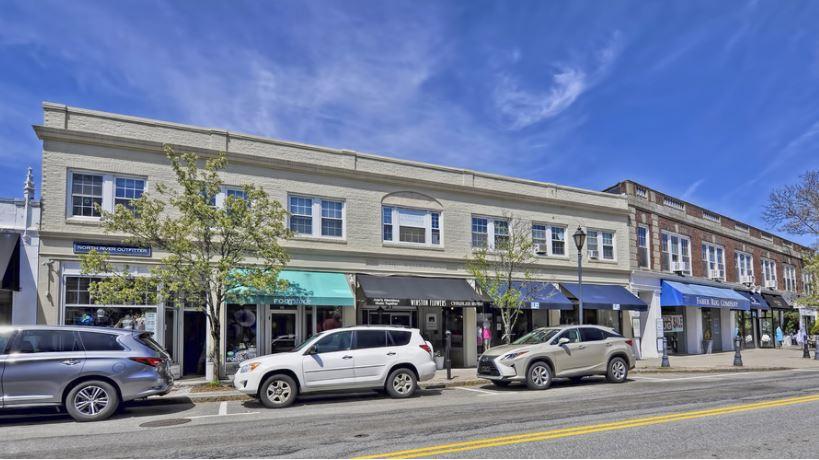
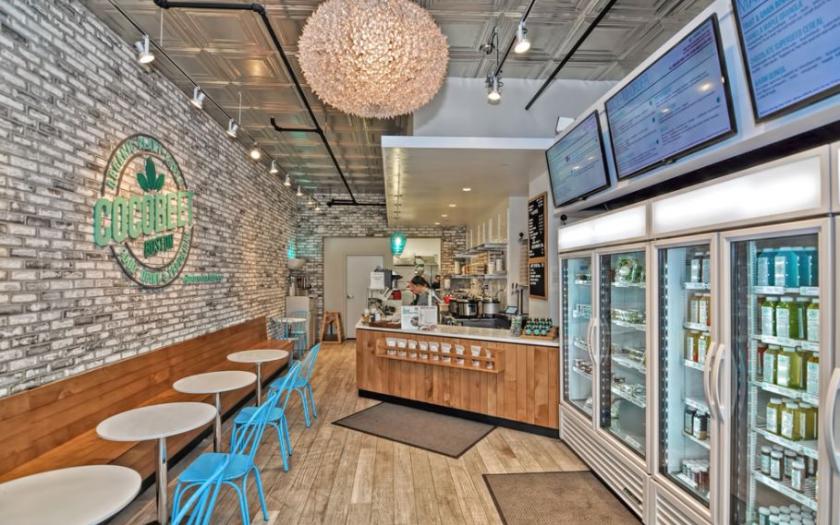
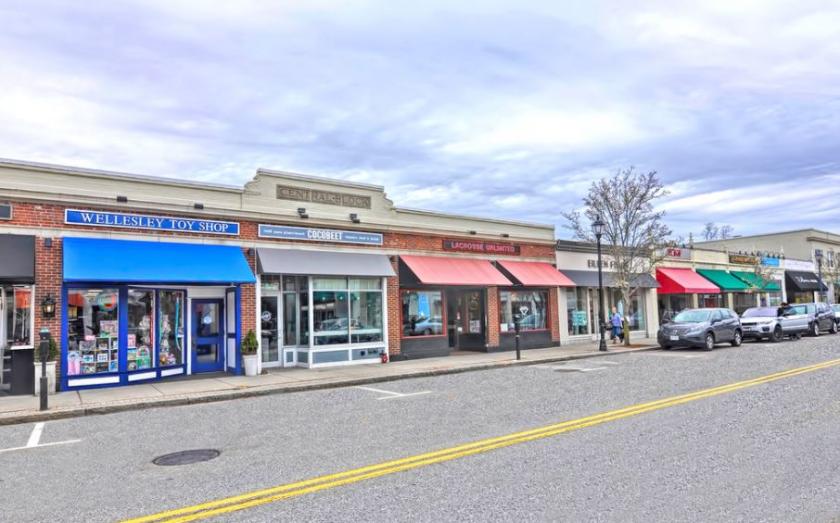
Wellesley Square Portfolio is a two-building portfolio in the premiere destination of Downtown Wellesley, Massachusetts. Wellesley Square Portfolio includes a 10,863 SF mixed use retail and multi-family building and a 6,047 SF retail building with 5 storefront units featuring high end retailers such as Eileen Fisher and boutique stores.
The portfolio is centrally located within Wellesley Square, which is home to over one hundred shops, eateries and local businesses.
Located directly on Route 135 & 16.
Premiere Boston suburb destination with high barriers to entry. Wellesley is one of the most sought-after and prestigious communities in Massachusetts.
The Wellesley Square Portfolio is located in the center of Wellesley's vibrant downtown and walkable retail center. Wellesley attracts strong local and national including the famous Smith and Wollensky, White’s Bakery, Whole Foods, Peets Coffee, Orangetheory Fitness, J. McLaughlin, Juniper Restaurant, Fiorella’s Express, Cache, and several boutique stores
Affluent Community - Voted among the top places to live in Massachusetts with a average household income of over $200,000 within 3 miles of the property.
Upside Potential - Minor improvements to the residential units will allow an investor to increase the below market apartment rents.
No part of this information may be copied, reproduced, repurposed, or screen-captured for any commercial purpose without prior written authorization from MyEListing.
While we strive to provide the most accurate information, all listing information, and demographic data, is provided by third-parties. As such, MyEListing will not be responsible for the accuracy of the information. It is strongly recommended that you verify all information with the listing agent, and any relevant agencies, prior to making any decisions.
What is the building size of this Retail property in Wellesley, MA?
The size of the building/unit at 25 Central Street in Wellesley is 16,910 square feet
What kind of Retail is the propery at 25 Central Street?
The property at 25 Central Street Wellesley, MA 02482 is listed as a Other Retail Retail property
What is the population within 1 mile of 25 Central Street in Wellesley?
The population within 1 mile of 25 Central Street Wellesley, MA 02482 is 9,888 people.
Who do I contact for questions about 25 Central Street?
You should contact the listing agent,
Marilyn Santiago, for any details regarding this commercial listing.