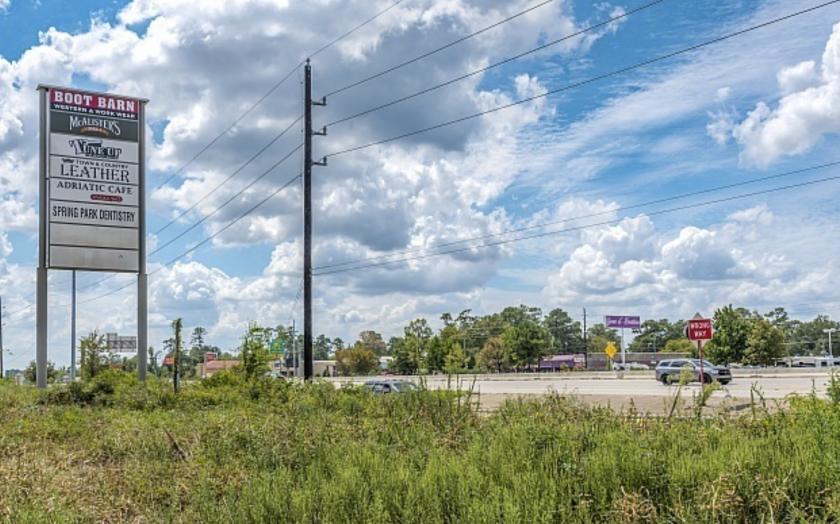
1-Mile | 3-Miles | 5-Miles | ||
---|---|---|---|---|
Total Population | 7,199 | 96,601 | 225,813 | |
Population Median Age | 39 | 35 | 34 | |
Population by Age | 0-9 Yrs | 892 (12%) | 14078 (14%) | 34931 (15%) |
10-19 Yrs | 985 (13%) | 14139 (14%) | 33892 (15%) | |
20-29 Yrs | 845 (11%) | 14212 (14%) | 32067 (14%) | |
30-39 Yrs | 1140 (15%) | 15082 (15%) | 36112 (15%) | |
40-49 Yrs | 812 (11%) | 13215 (13%) | 32448 (14%) | |
50-59 Yrs | 976 (13%) | 11023 (11%) | 24397 (10%) | |
60-69 Yrs | 665 (9%) | 8337 (8%) | 19174 (8%) | |
70+ Yrs | 884 (12%) | 6515 (6%) | 12792 (5%) | |
Median HH Income | $84,129 | $64,021 | $66,116 | |
Total Household Income | < 24K | 315 (12%) | 5385 (15%) | 11555 (14%) |
25-49K | 363 (13%) | 8071 (23%) | 17671 (22%) | |
50-74K | 492 (18%) | 6622 (19%) | 15250 (19%) | |
75-99K | 361 (13%) | 4215 (12%) | 10435 (13%) | |
100-199K | 823 (31%) | 8327 (23%) | 18528 (23%) | |
200K+ | 250 (9%) | 2135 (6%) | 5310 (6%) | |
Highest Education Level | No Diploma | 339 | 6470 | 15713 |
Diploma or GED | 994 | 14572 | 34020 | |
Some College | 1228 | 16726 | 36387 | |
Assoc. Degree | 562 | 6034 | 13606 | |
Bachelors Degree | 1229 | 12252 | 28797 | |
Higher Degree | 524 | 5330 | 13162 | |
Total Housing Units | 2,848 | 38,274 | 85,281 | |
--Owner-Occupied | 1,852 | 19,687 | 44,845 | |
--Renter-Occupied | 753 | 15,067 | 33,903 | |
Owner-Occupied Values | < 100K | 30 | 1503 | 3985 |
100-199K | 1040 | 11612 | 24450 | |
200-299K | 654 | 4688 | 10925 | |
300-399K | 108 | 1188 | 3120 | |
400-499K | 20 | 401 | 1187 | |
500K+ | 1 | 294 | 1179 | |
Total Working Age Population | 5,643 | 73,914 | 170,133 | |
In Work Force | 3,907 | 51,947 | 120,327 | |
Not In Work Force | 1,736 | 21,968 | 49,806 | |
Workforce Employed | 3,700 | 49,235 | 114,303 | |
Workforce Unemployed | 208 | 2,679 | 5,976 | |
Civlian Workforce | 3,907 | 51,914 | 120,279 | |
Military Workforce | 0 | 33 | 48 | |
Total Households | 2,605 | 34,753 | 78,749 | |
Family Households | 1,869 | 23,452 | 55,609 | |
Non-Family Households | 736 | 11,301 | 23,140 | |
Married Couple | 1,571 | 16,661 | 38,743 | |
Other Family | 298 | 6,792 | 16,866 | |
Married w/Child | 602 | 7,446 | 18,299 | |
Single Male w/Child | 44 | 684 | 1,729 | |
Single Female w/Child | 124 | 3,268 | 8,229 |
Population Change Last Two Decades - Plus Projection
2000 | % | 2010 | % | 2020 | % | 2030 | |
---|---|---|---|---|---|---|---|
Texas | 20,851,820 | +21 | 25,145,561 | +18 | 29,677,668 | +18 | 34,894,452 |
Harris County | 3,400,578 | +20 | 4,092,459 | +22 | 4,978,845 | +19 | 5,924,750 |
Montgomery County | 293,768 | +55 | 455,746 | +35 | 613,951 | +35 | 831,450 |
Total Working Age Population:
Total Households:
Total Working Age Population:
Total Households:
Total Working Age Population:
Total Households: