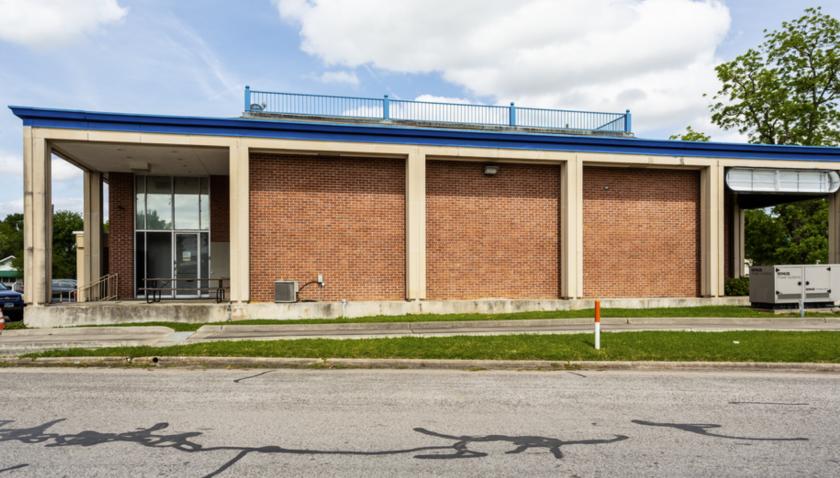
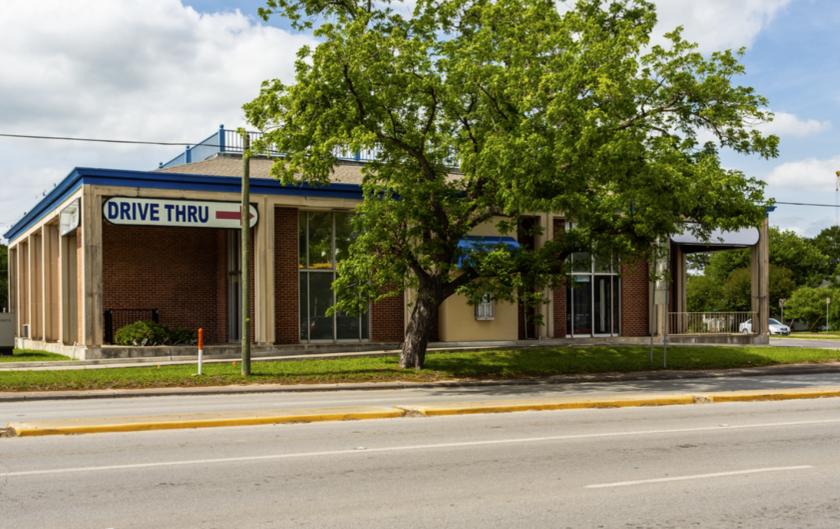
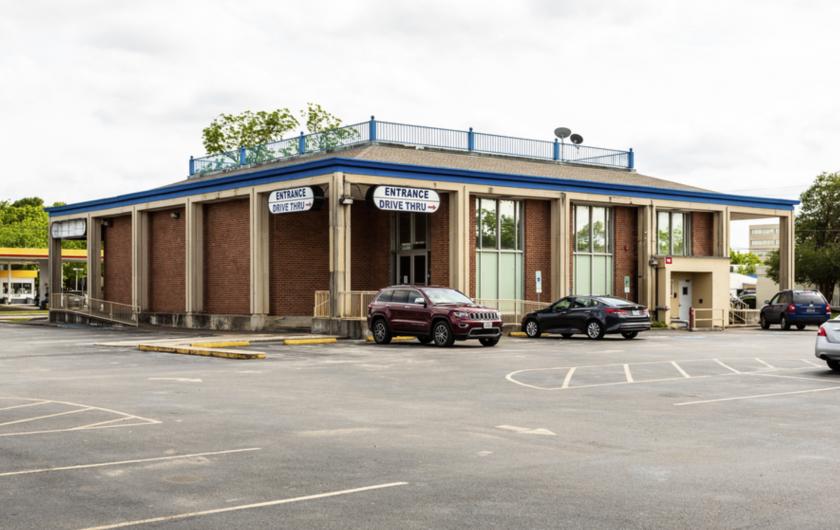
1-Mile | 3-Miles | 5-Miles | ||
---|---|---|---|---|
Total Population | 7,428 | 50,257 | 100,786 | |
Population Median Age | 37 | 36 | 37 | |
Population by Age | 0-9 Yrs | 1076 (14%) | 7007 (13%) | 13965 (13%) |
10-19 Yrs | 1243 (16%) | 8239 (16%) | 14885 (14%) | |
20-29 Yrs | 797 (10%) | 6094 (12%) | 12022 (11%) | |
30-39 Yrs | 1129 (15%) | 7152 (14%) | 14122 (14%) | |
40-49 Yrs | 801 (10%) | 6064 (12%) | 13248 (13%) | |
50-59 Yrs | 876 (11%) | 5792 (11%) | 12888 (12%) | |
60-69 Yrs | 840 (11%) | 6011 (11%) | 12065 (11%) | |
70+ Yrs | 667 (8%) | 3897 (7%) | 7591 (7%) | |
Median HH Income | $50,120 | $62,178 | $76,820 | |
Total Household Income | < 24K | 572 (24%) | 3292 (20%) | 4944 (15%) |
25-49K | 600 (25%) | 3519 (21%) | 5849 (18%) | |
50-74K | 460 (19%) | 2706 (16%) | 4952 (15%) | |
75-99K | 219 (9%) | 1753 (10%) | 3509 (10%) | |
100-199K | 411 (17%) | 4120 (25%) | 9537 (29%) | |
200K+ | 86 (3%) | 1009 (6%) | 3210 (10%) | |
Highest Education Level | No Diploma | 1324 | 5840 | 9239 |
Diploma or GED | 1696 | 8512 | 15913 | |
Some College | 790 | 6430 | 13616 | |
Assoc. Degree | 239 | 2551 | 4904 | |
Bachelors Degree | 483 | 5936 | 14384 | |
Higher Degree | 203 | 2884 | 8034 | |
Total Housing Units | 2,597 | 17,781 | 34,594 | |
--Owner-Occupied | 1,234 | 9,409 | 21,580 | |
--Renter-Occupied | 1,114 | 6,988 | 10,422 | |
Owner-Occupied Values | < 100K | 549 | 1892 | 2793 |
100-199K | 384 | 2452 | 4994 | |
200-299K | 133 | 2723 | 7611 | |
300-399K | 77 | 1473 | 3830 | |
400-499K | 36 | 436 | 1310 | |
500K+ | 55 | 434 | 1042 | |
Total Working Age Population | 5,566 | 38,150 | 77,783 | |
In Work Force | 3,315 | 23,643 | 49,013 | |
Not In Work Force | 2,251 | 14,506 | 28,771 | |
Workforce Employed | 3,150 | 22,574 | 46,555 | |
Workforce Unemployed | 165 | 1,070 | 2,431 | |
Civlian Workforce | 3,315 | 23,643 | 48,986 | |
Military Workforce | 0 | 0 | 27 | |
Total Households | 2,348 | 16,397 | 32,002 | |
Family Households | 1,734 | 12,308 | 24,854 | |
Non-Family Households | 614 | 4,090 | 7,148 | |
Married Couple | 936 | 8,319 | 18,626 | |
Other Family | 798 | 3,989 | 6,228 | |
Married w/Child | 332 | 3,245 | 7,966 | |
Single Male w/Child | 75 | 360 | 719 | |
Single Female w/Child | 263 | 1,673 | 2,356 |
Population Change Last Two Decades - Plus Projection
2000 | % | 2010 | % | 2020 | % | 2030 | |
---|---|---|---|---|---|---|---|
Texas | 20,851,820 | +21 | 25,145,561 | +18 | 29,677,668 | +18 | 34,894,452 |
Brazoria County | 241,767 | +30 | 313,166 | +20 | 375,869 | +20 | 452,517 |
Fort Bend County | 354,452 | +65 | 585,375 | +44 | 840,383 | +43 | 1,203,029 |
Harris County | 3,400,578 | +20 | 4,092,459 | +22 | 4,978,845 | +19 | 5,924,750 |
Wharton County | 41,188 | 0 | 41,280 | +2 | 41,941 | +1 | 42,321 |
Total Working Age Population:
Total Households:
Total Working Age Population:
Total Households:
Total Working Age Population:
Total Households: