Retail Space
2519 Rice Boulevard Houston, TX 77005
2519 Rice Boulevard Houston, TX 77005
Details & Description
Property Highlights
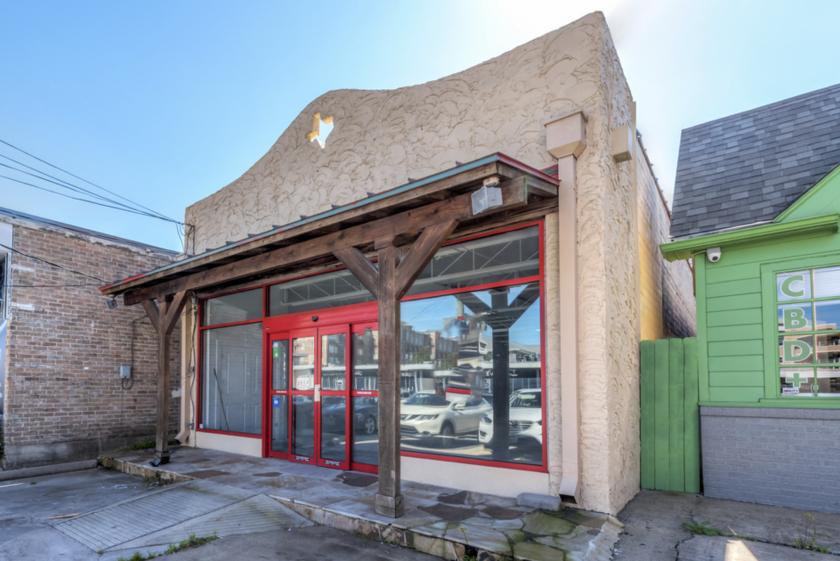
• Single-tenant 2,024 SF freestanding retail building for sale in the heart of Houstons Rice Village shopping district
• High day-time population mixed with lots of foot traffic
Listing Agents

Edward Heap
O: 281-661-3227
edward.heap@srsre.com
O: 281-661-3227
edward.heap@srsre.com
While we strive to provide the most accurate information, all listing information, and demographic data, is provided by third-parties. As such, MyEListing will not be responsible for the accuracy of the information. It is strongly recommended that you verify all information with the listing agent, and any relevant agencies, prior to making any decisions.


