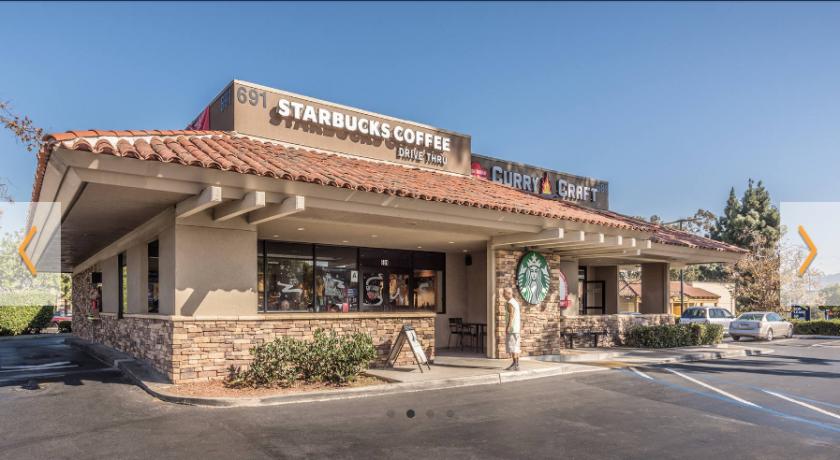
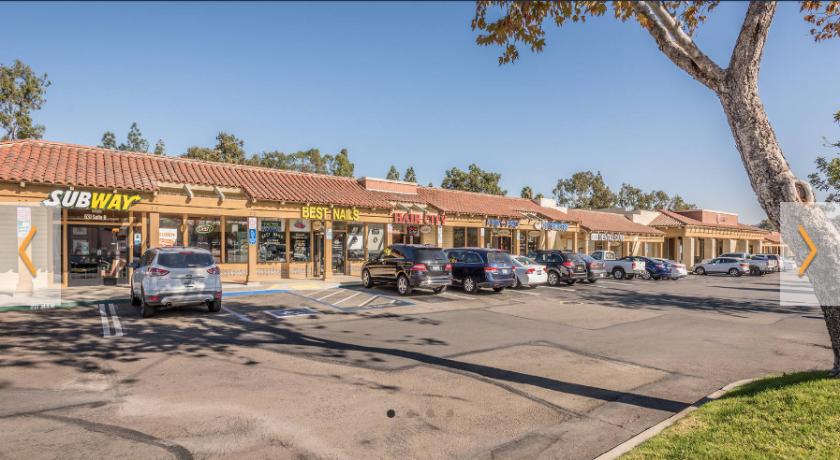
1-Mile | 3-Miles | 5-Miles | ||
---|---|---|---|---|
Total Population | 11,714 | 93,192 | 211,962 | |
Population Median Age | 45 | 37 | 38 | |
Population by Age | 0-9 Yrs | 1306 (11%) | 13689 (14%) | 28745 (13%) |
10-19 Yrs | 1091 (9%) | 13765 (14%) | 29226 (13%) | |
20-29 Yrs | 1022 (8%) | 10999 (11%) | 25150 (11%) | |
30-39 Yrs | 1466 (12%) | 12685 (13%) | 27300 (12%) | |
40-49 Yrs | 1190 (10%) | 13348 (14%) | 29058 (13%) | |
50-59 Yrs | 1354 (11%) | 10891 (11%) | 27995 (13%) | |
60-69 Yrs | 1971 (16%) | 9135 (9%) | 22043 (10%) | |
70+ Yrs | 2313 (19%) | 8680 (9%) | 22446 (10%) | |
Median HH Income | $62,057 | $82,841 | $94,119 | |
Total Household Income | < 24K | 929 (20%) | 3985 (13%) | 7794 (10%) |
25-49K | 1015 (22%) | 5339 (17%) | 11001 (15%) | |
50-74K | 722 (15%) | 4967 (16%) | 10822 (15%) | |
75-99K | 466 (10%) | 3263 (10%) | 8262 (11%) | |
100-199K | 1096 (24%) | 8746 (28%) | 22254 (30%) | |
200K+ | 326 (7%) | 4329 (14%) | 11739 (16%) | |
Highest Education Level | No Diploma | 1506 | 8351 | 14728 |
Diploma or GED | 1719 | 10572 | 22989 | |
Some College | 2176 | 12722 | 30077 | |
Assoc. Degree | 772 | 4436 | 11952 | |
Bachelors Degree | 1854 | 15740 | 38787 | |
Higher Degree | 871 | 8585 | 23497 | |
Total Housing Units | 4,882 | 32,273 | 75,984 | |
--Owner-Occupied | 3,323 | 19,033 | 47,686 | |
--Renter-Occupied | 1,230 | 11,596 | 24,186 | |
Owner-Occupied Values | < 100K | 374 | 1071 | 1580 |
100-199K | 502 | 907 | 1536 | |
200-299K | 270 | 876 | 2017 | |
300-399K | 393 | 1081 | 2804 | |
400-499K | 543 | 2842 | 7196 | |
500K+ | 1241 | 12256 | 32553 | |
Total Working Age Population | 9,699 | 70,989 | 165,540 | |
In Work Force | 5,495 | 46,805 | 108,251 | |
Not In Work Force | 4,205 | 24,184 | 57,289 | |
Workforce Employed | 5,365 | 44,738 | 102,560 | |
Workforce Unemployed | 106 | 1,797 | 4,914 | |
Civlian Workforce | 5,471 | 46,536 | 107,474 | |
Military Workforce | 23 | 269 | 777 | |
Total Households | 4,553 | 30,628 | 71,872 | |
Family Households | 2,678 | 22,568 | 53,162 | |
Non-Family Households | 1,874 | 8,060 | 18,710 | |
Married Couple | 2,081 | 17,304 | 41,721 | |
Other Family | 597 | 5,264 | 11,441 | |
Married w/Child | 836 | 8,680 | 19,096 | |
Single Male w/Child | 33 | 752 | 1,661 | |
Single Female w/Child | 187 | 1,977 | 3,831 |
Population Change Last Two Decades - Plus Projection
2000 | % | 2010 | % | 2020 | % | 2030 | |
---|---|---|---|---|---|---|---|
California | 33,871,648 | +10 | 37,253,956 | +9 | 40,467,295 | +8 | 43,631,295 |
San Diego County | 2,813,833 | +10 | 3,095,313 | +10 | 3,390,529 | +6 | 3,608,286 |
Total Working Age Population:
Total Households:
Total Working Age Population:
Total Households:
Total Working Age Population:
Total Households: