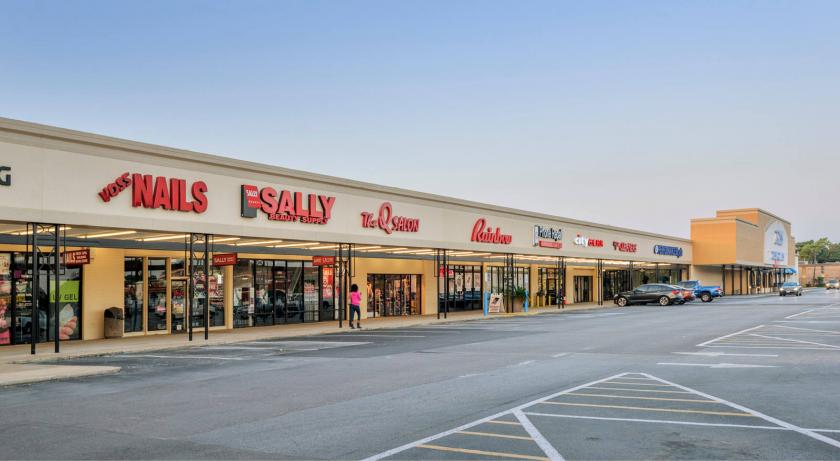
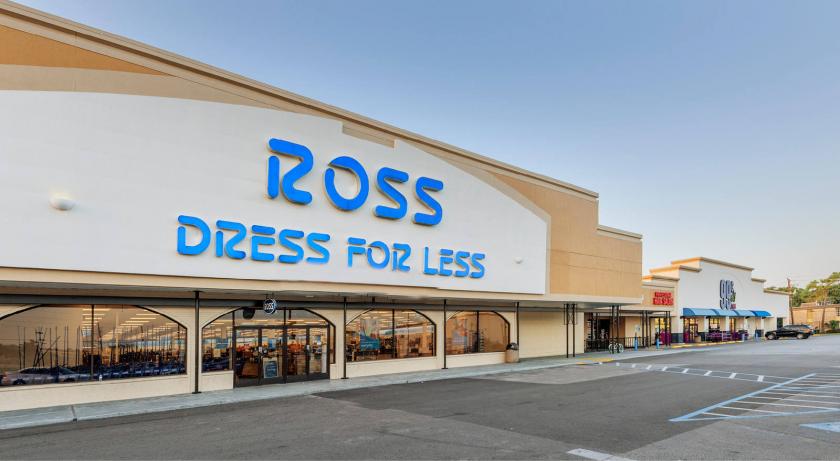
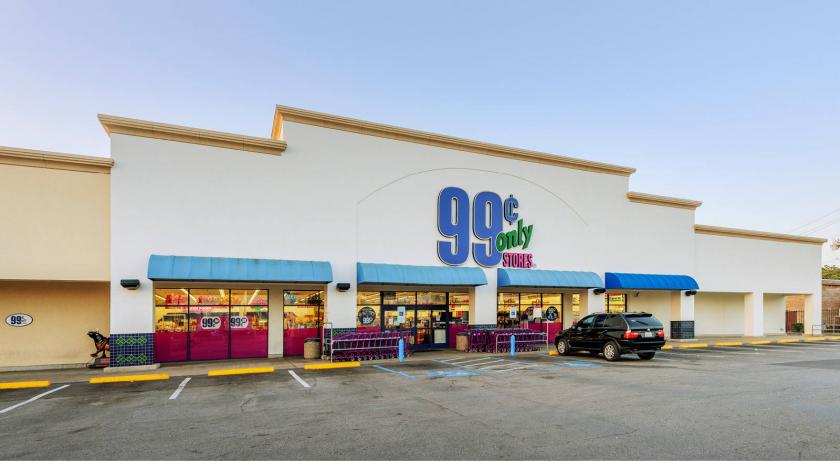
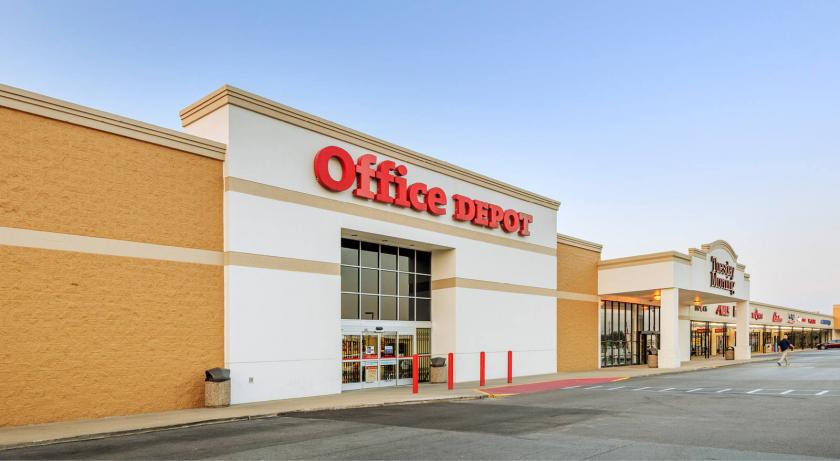
1-Mile | 3-Miles | 5-Miles | ||
---|---|---|---|---|
Total Population | 35,260 | 226,485 | 525,810 | |
Population Median Age | 33 | 35 | 35 | |
Population by Age | 0-9 Yrs | 5709 (16%) | 33446 (14%) | 78198 (14%) |
10-19 Yrs | 2766 (7%) | 23600 (10%) | 61022 (11%) | |
20-29 Yrs | 7839 (22%) | 40430 (17%) | 84011 (15%) | |
30-39 Yrs | 7905 (22%) | 42836 (18%) | 92105 (17%) | |
40-49 Yrs | 3916 (11%) | 29694 (13%) | 69793 (13%) | |
50-59 Yrs | 2756 (7%) | 23311 (10%) | 57523 (10%) | |
60-69 Yrs | 2066 (5%) | 17502 (7%) | 44043 (8%) | |
70+ Yrs | 2303 (6%) | 15666 (6%) | 39115 (7%) | |
Median HH Income | $47,565 | $51,521 | $58,059 | |
Total Household Income | < 24K | 4286 (27%) | 23695 (24%) | 47288 (22%) |
25-49K | 3969 (25%) | 22952 (24%) | 47030 (22%) | |
50-74K | 2646 (16%) | 14399 (15%) | 30780 (14%) | |
75-99K | 1552 (9%) | 9215 (9%) | 20697 (9%) | |
100-199K | 2382 (15%) | 14656 (15%) | 35277 (16%) | |
200K+ | 883 (5%) | 10628 (11%) | 31816 (14%) | |
Highest Education Level | No Diploma | 3477 | 27568 | 57864 |
Diploma or GED | 3557 | 27017 | 57410 | |
Some College | 4261 | 23318 | 52561 | |
Assoc. Degree | 1666 | 8008 | 16979 | |
Bachelors Degree | 6897 | 42309 | 97147 | |
Higher Degree | 3600 | 26139 | 71802 | |
Total Housing Units | 17,957 | 109,045 | 244,025 | |
--Owner-Occupied | 2,876 | 27,265 | 75,930 | |
--Renter-Occupied | 12,843 | 68,280 | 136,960 | |
Owner-Occupied Values | < 100K | 378 | 3293 | 7066 |
100-199K | 478 | 5557 | 12175 | |
200-299K | 319 | 3407 | 8986 | |
300-399K | 380 | 1977 | 8102 | |
400-499K | 342 | 1495 | 5201 | |
500K+ | 980 | 11536 | 34400 | |
Total Working Age Population | 27,652 | 177,840 | 408,192 | |
In Work Force | 20,600 | 127,115 | 286,880 | |
Not In Work Force | 7,052 | 50,726 | 121,312 | |
Workforce Employed | 19,530 | 121,209 | 273,804 | |
Workforce Unemployed | 1,071 | 5,906 | 12,938 | |
Civlian Workforce | 20,600 | 127,115 | 286,741 | |
Military Workforce | 0 | 0 | 139 | |
Total Households | 15,718 | 95,545 | 212,889 | |
Family Households | 7,507 | 51,303 | 124,235 | |
Non-Family Households | 8,211 | 44,242 | 88,654 | |
Married Couple | 4,886 | 34,367 | 86,539 | |
Other Family | 2,621 | 16,936 | 37,697 | |
Married w/Child | 2,717 | 16,419 | 40,954 | |
Single Male w/Child | 426 | 2,482 | 5,021 | |
Single Female w/Child | 804 | 6,571 | 16,242 |
Population Change Last Two Decades - Plus Projection
2000 | % | 2010 | % | 2020 | % | 2030 | |
---|---|---|---|---|---|---|---|
Texas | 20,851,820 | +21 | 25,145,561 | +18 | 29,677,668 | +18 | 34,894,452 |
Fort Bend County | 354,452 | +65 | 585,375 | +44 | 840,383 | +43 | 1,203,029 |
Harris County | 3,400,578 | +20 | 4,092,459 | +22 | 4,978,845 | +19 | 5,924,750 |
Total Working Age Population:
Total Households:
Total Working Age Population:
Total Households:
Total Working Age Population:
Total Households: