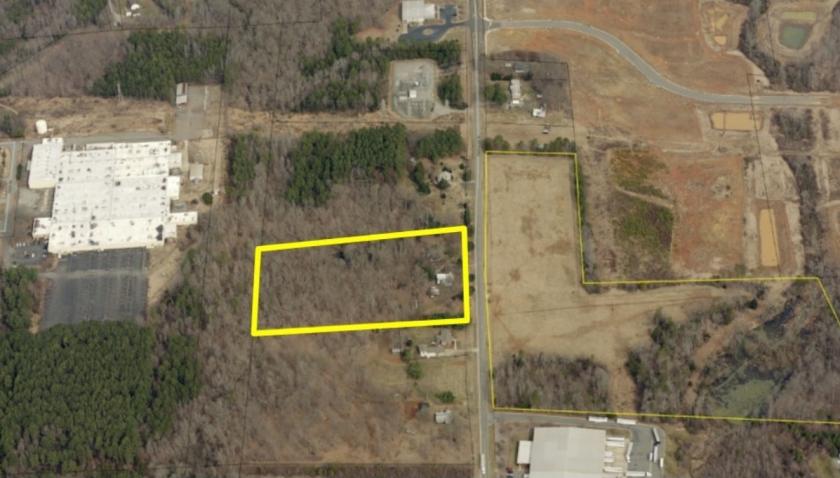
1-Mile | 3-Miles | 5-Miles | ||
---|---|---|---|---|
Total Population | 3,077 | 18,621 | 32,142 | |
Population Median Age | 39 | 37 | 38 | |
Population by Age | 0-9 Yrs | 294 (9%) | 2468 (13%) | 4127 (12%) |
10-19 Yrs | 454 (14%) | 2951 (15%) | 4968 (15%) | |
20-29 Yrs | 410 (13%) | 1990 (10%) | 3284 (10%) | |
30-39 Yrs | 495 (16%) | 2890 (15%) | 4374 (13%) | |
40-49 Yrs | 374 (12%) | 2321 (12%) | 4125 (12%) | |
50-59 Yrs | 386 (12%) | 2450 (13%) | 4572 (14%) | |
60-69 Yrs | 356 (11%) | 1879 (10%) | 3719 (11%) | |
70+ Yrs | 307 (9%) | 1671 (8%) | 2974 (9%) | |
Median HH Income | $56,956 | $60,109 | $60,537 | |
Total Household Income | < 24K | 261 (21%) | 1384 (18%) | 2218 (17%) |
25-49K | 304 (24%) | 1971 (26%) | 3221 (25%) | |
50-74K | 183 (14%) | 1162 (15%) | 2110 (16%) | |
75-99K | 263 (21%) | 1272 (17%) | 1922 (15%) | |
100-199K | 190 (15%) | 1377 (18%) | 2540 (20%) | |
200K+ | 38 (3%) | 225 (3%) | 431 (3%) | |
Highest Education Level | No Diploma | 145 | 1016 | 2053 |
Diploma or GED | 595 | 2858 | 5405 | |
Some College | 610 | 3156 | 5256 | |
Assoc. Degree | 198 | 1397 | 2505 | |
Bachelors Degree | 465 | 3019 | 4831 | |
Higher Degree | 227 | 1290 | 2087 | |
Total Housing Units | 1,398 | 8,219 | 13,618 | |
--Owner-Occupied | 843 | 4,864 | 8,822 | |
--Renter-Occupied | 396 | 2,527 | 3,620 | |
Owner-Occupied Values | < 100K | 142 | 585 | 1383 |
100-199K | 267 | 2352 | 3859 | |
200-299K | 416 | 1512 | 2441 | |
300-399K | 6 | 216 | 636 | |
400-499K | 8 | 74 | 233 | |
500K+ | 5 | 124 | 269 | |
Total Working Age Population | 2,499 | 14,539 | 25,207 | |
In Work Force | 1,546 | 9,437 | 16,396 | |
Not In Work Force | 953 | 5,101 | 8,812 | |
Workforce Employed | 1,461 | 8,958 | 15,644 | |
Workforce Unemployed | 85 | 479 | 748 | |
Civlian Workforce | 1,546 | 9,437 | 16,392 | |
Military Workforce | 0 | 0 | 3 | |
Total Households | 1,239 | 7,391 | 12,442 | |
Family Households | 783 | 4,696 | 8,354 | |
Non-Family Households | 456 | 2,695 | 4,087 | |
Married Couple | 551 | 3,541 | 6,330 | |
Other Family | 232 | 1,155 | 2,025 | |
Married w/Child | 340 | 1,747 | 2,727 | |
Single Male w/Child | 45 | 172 | 295 | |
Single Female w/Child | 35 | 509 | 868 |
Population Change Last Two Decades - Plus Projection
2000 | % | 2010 | % | 2020 | % | 2030 | |
---|---|---|---|---|---|---|---|
North Carolina | 8,049,313 | +18 | 9,535,483 | +11 | 10,630,691 | +11 | 11,836,070 |
Alamance County | 130,800 | +16 | 151,131 | +15 | 174,055 | +11 | 192,656 |
Orange County | 118,227 | +13 | 133,801 | +11 | 148,610 | +10 | 163,699 |
Total Working Age Population:
Total Households:
Total Working Age Population:
Total Households:
Total Working Age Population:
Total Households: