Specialty Real Estate
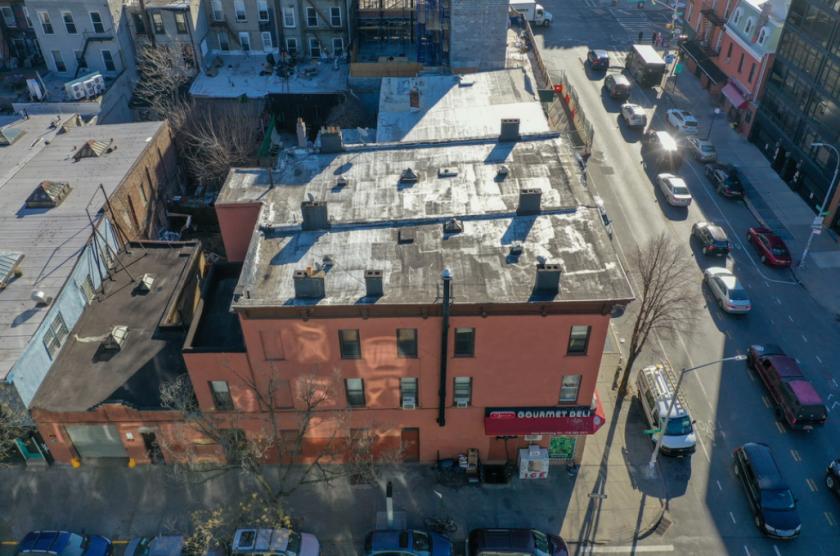
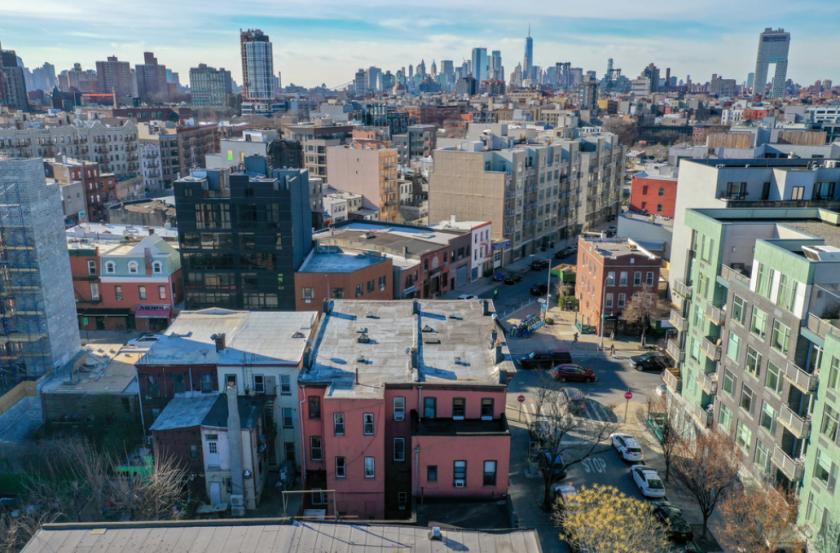
372 Union Avenue Brooklyn, NY 11211
372 Union Avenue Brooklyn, NY 11211

Details & Description
Additional Photos


Listing Agents

Robert Moore
O: 646-933-2650
rmoore@b6realestate.com
O: 646-933-2650
rmoore@b6realestate.com
While we strive to provide the most accurate information, all listing information, and demographic data, is provided by third-parties. As such, MyEListing will not be responsible for the accuracy of the information. It is strongly recommended that you verify all information with the listing agent, and any relevant agencies, prior to making any decisions.


