Specialty Real Estate
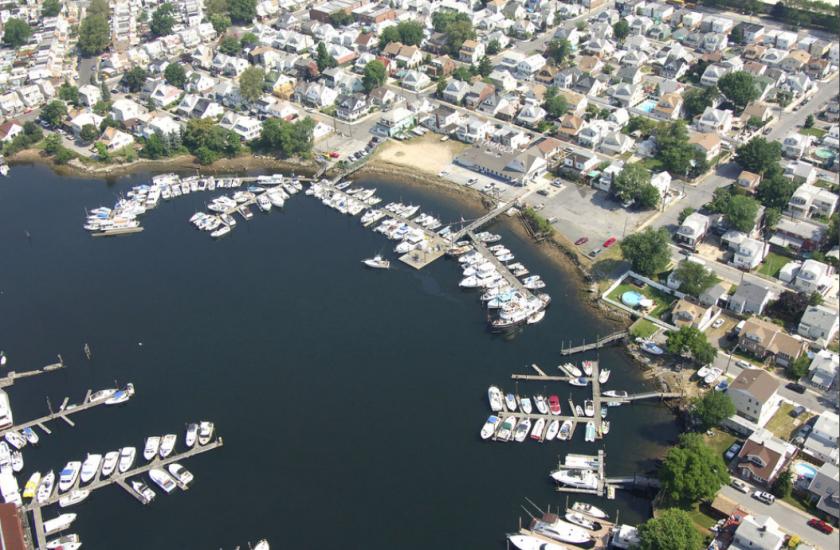
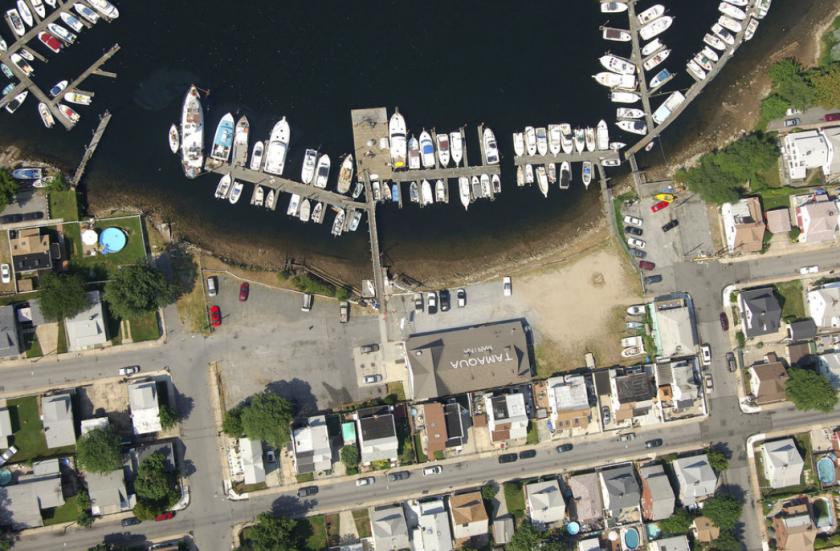
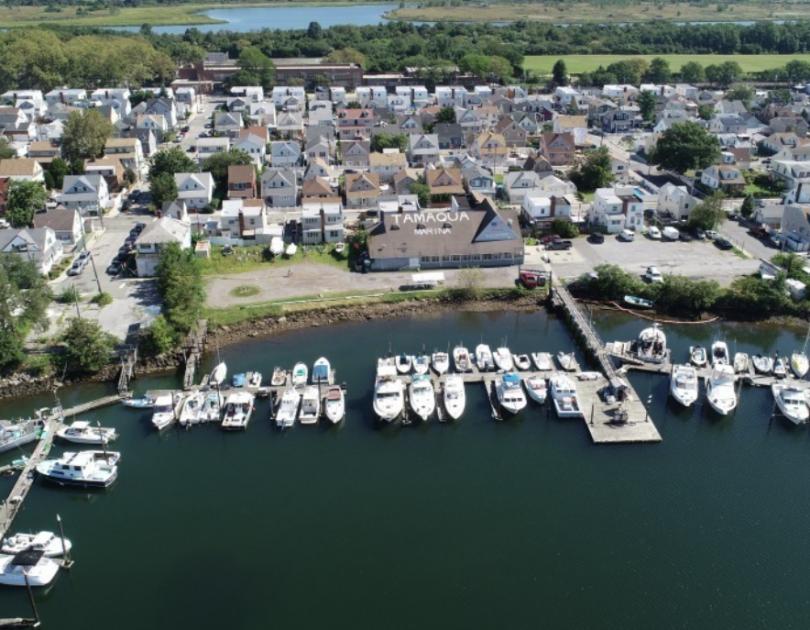
84 Ebony Court Brooklyn, NY 11229
84 Ebony Court Brooklyn, NY 11229
Details & Description
Listing Agents

John Barney
O: 646-933-2632
jbarney@b6realestate.com
O: 646-933-2632
jbarney@b6realestate.com
While we strive to provide the most accurate information, all listing information, and demographic data, is provided by third-parties. As such, MyEListing will not be responsible for the accuracy of the information. It is strongly recommended that you verify all information with the listing agent, and any relevant agencies, prior to making any decisions.