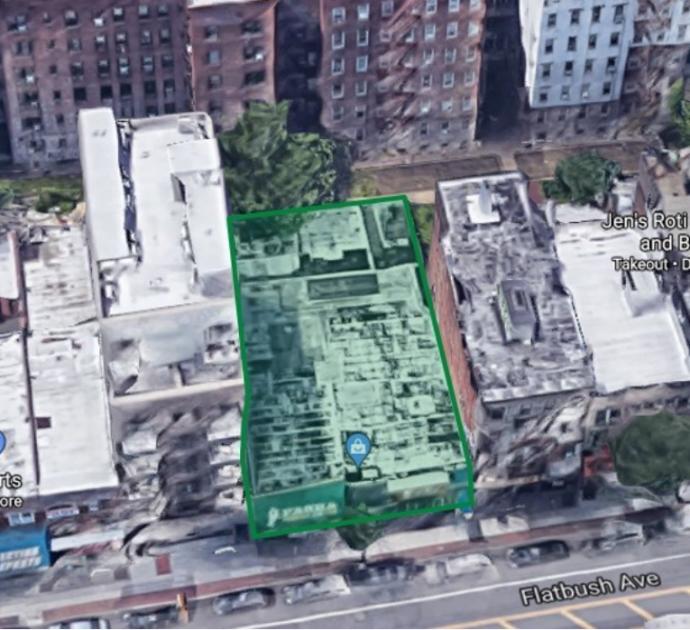
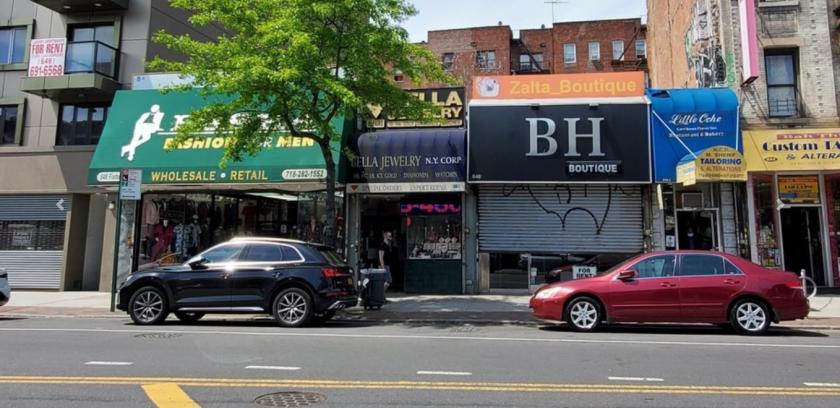
1-Mile | 3-Miles | 5-Miles | ||
---|---|---|---|---|
Total Population | 168,798 | 1,279,283 | 2,660,616 | |
Population Median Age | 38 | 37 | 37 | |
Population by Age | 0-9 Yrs | 19955 (11%) | 177098 (13%) | 354144 (13%) |
10-19 Yrs | 18593 (11%) | 149013 (11%) | 300173 (11%) | |
20-29 Yrs | 26809 (15%) | 200001 (15%) | 426641 (16%) | |
30-39 Yrs | 30375 (17%) | 211174 (16%) | 436393 (16%) | |
40-49 Yrs | 22113 (13%) | 162534 (12%) | 334132 (12%) | |
50-59 Yrs | 20115 (11%) | 146272 (11%) | 306553 (11%) | |
60-69 Yrs | 16734 (9%) | 124165 (9%) | 261869 (9%) | |
70+ Yrs | 14103 (8%) | 109025 (8%) | 240710 (9%) | |
Median HH Income | $63,236 | $62,651 | $61,442 | |
Total Household Income | < 24K | 13141 (20%) | 108953 (23%) | 242113 (24%) |
25-49K | 13318 (20%) | 89485 (18%) | 183638 (18%) | |
50-74K | 11301 (17%) | 69328 (14%) | 137517 (13%) | |
75-99K | 9106 (13%) | 54218 (11%) | 110353 (11%) | |
100-199K | 13697 (21%) | 102648 (21%) | 214369 (21%) | |
200K+ | 4564 (7%) | 47207 (10%) | 99144 (10%) | |
Highest Education Level | No Diploma | 15359 | 146366 | 334043 |
Diploma or GED | 35094 | 214600 | 460410 | |
Some College | 19490 | 120953 | 239216 | |
Assoc. Degree | 6577 | 51328 | 108844 | |
Bachelors Degree | 25832 | 196810 | 415345 | |
Higher Degree | 17541 | 143801 | 276459 | |
Total Housing Units | 70,943 | 514,291 | 1,077,629 | |
--Owner-Occupied | 12,289 | 140,078 | 293,566 | |
--Renter-Occupied | 52,838 | 331,761 | 693,568 | |
Owner-Occupied Values | < 100K | 490 | 4081 | 9363 |
100-199K | 321 | 3258 | 8402 | |
200-299K | 600 | 5362 | 13782 | |
300-399K | 1293 | 9458 | 20610 | |
400-499K | 1462 | 14899 | 28666 | |
500K+ | 8123 | 103019 | 212743 | |
Total Working Age Population | 137,323 | 1,007,522 | 2,118,556 | |
In Work Force | 92,242 | 658,243 | 1,355,705 | |
Not In Work Force | 45,081 | 349,279 | 762,851 | |
Workforce Employed | 86,785 | 617,862 | 1,273,091 | |
Workforce Unemployed | 5,391 | 40,196 | 81,945 | |
Civlian Workforce | 92,176 | 658,057 | 1,355,037 | |
Military Workforce | 66 | 186 | 669 | |
Total Households | 65,127 | 471,838 | 987,134 | |
Family Households | 38,196 | 286,991 | 601,768 | |
Non-Family Households | 26,930 | 184,847 | 385,366 | |
Married Couple | 19,437 | 174,020 | 372,546 | |
Other Family | 18,759 | 112,972 | 229,221 | |
Married w/Child | 8,809 | 82,050 | 167,632 | |
Single Male w/Child | 1,199 | 8,030 | 16,696 | |
Single Female w/Child | 5,714 | 35,600 | 72,763 |
Population Change Last Two Decades - Plus Projection
2000 | % | 2010 | % | 2020 | % | 2030 | |
---|---|---|---|---|---|---|---|
New Jersey | 8,414,350 | +4 | 8,791,894 | +4 | 9,132,700 | +4 | 9,530,900 |
Hudson County | 608,975 | +4 | 634,266 | +12 | 708,100 | +6 | 747,400 |
New York | 18,976,457 | +2 | 19,378,102 | +4 | 20,146,131 | +2 | 20,604,030 |
Kings County | 2,465,326 | +2 | 2,504,700 | +9 | 2,738,283 | +5 | 2,863,996 |
New York County | 1,537,195 | +3 | 1,585,873 | +6 | 1,688,894 | +2 | 1,727,631 |
Queens County | 2,229,379 | 0 | 2,230,722 | +9 | 2,436,549 | +5 | 2,565,268 |
Richmond County | 443,728 | +6 | 468,730 | +3 | 481,351 | +1 | 488,119 |
Total Working Age Population:
Total Households:
Total Working Age Population:
Total Households:
Total Working Age Population:
Total Households: