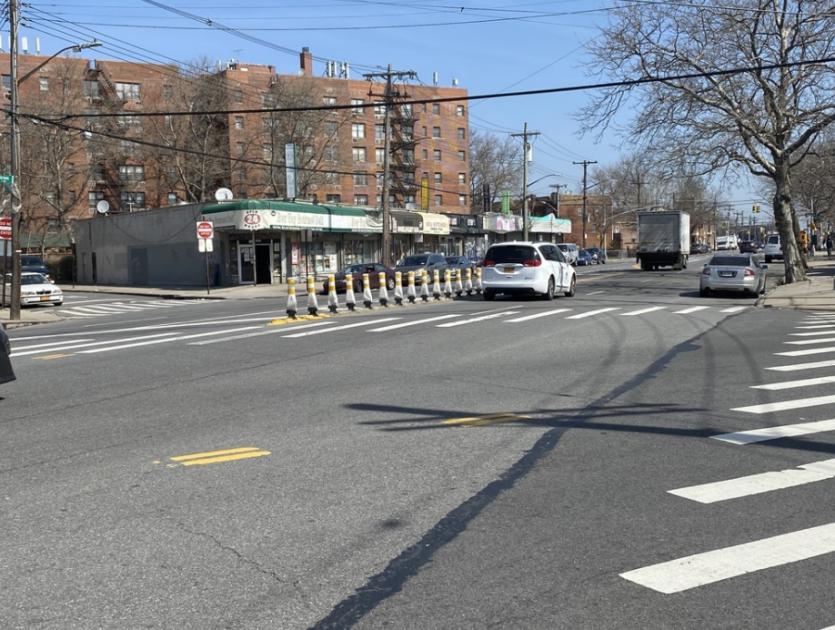
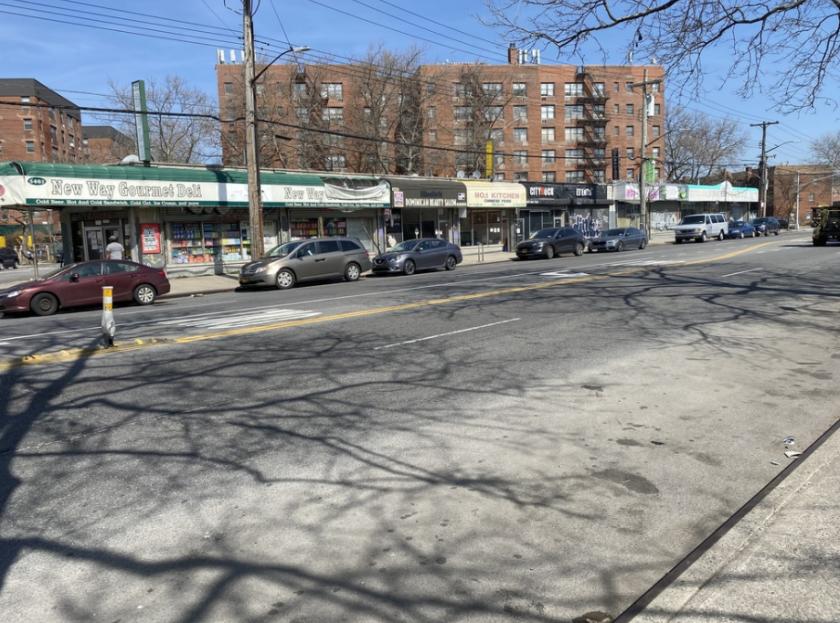
1-Mile | 3-Miles | 5-Miles | ||
---|---|---|---|---|
Total Population | 98,614 | 878,736 | 2,171,382 | |
Population Median Age | 40 | 38 | 37 | |
Population by Age | 0-9 Yrs | 10909 (11%) | 115365 (13%) | 291835 (13%) |
10-19 Yrs | 12280 (12%) | 109781 (12%) | 252866 (11%) | |
20-29 Yrs | 13212 (13%) | 124495 (14%) | 334134 (15%) | |
30-39 Yrs | 12423 (12%) | 120221 (13%) | 332319 (15%) | |
40-49 Yrs | 12053 (12%) | 108669 (12%) | 271561 (12%) | |
50-59 Yrs | 14143 (14%) | 111176 (12%) | 260536 (11%) | |
60-69 Yrs | 12913 (13%) | 99696 (11%) | 223142 (10%) | |
70+ Yrs | 10681 (10%) | 89333 (10%) | 204988 (9%) | |
Median HH Income | $78,114 | $57,249 | $58,129 | |
Total Household Income | < 24K | 5067 (15%) | 78646 (24%) | 197482 (25%) |
25-49K | 5959 (17%) | 66651 (20%) | 154621 (19%) | |
50-74K | 5042 (15%) | 50462 (15%) | 116396 (14%) | |
75-99K | 4842 (14%) | 38880 (12%) | 91084 (11%) | |
100-199K | 9793 (29%) | 67500 (20%) | 165143 (20%) | |
200K+ | 2640 (7%) | 20242 (6%) | 63143 (8%) | |
Highest Education Level | No Diploma | 7599 | 86531 | 267041 |
Diploma or GED | 21210 | 177799 | 407654 | |
Some College | 13078 | 99598 | 203285 | |
Assoc. Degree | 5811 | 44148 | 97481 | |
Bachelors Degree | 13647 | 116304 | 309271 | |
Higher Degree | 8046 | 73599 | 203009 | |
Total Housing Units | 35,719 | 349,900 | 859,144 | |
--Owner-Occupied | 19,459 | 112,586 | 254,792 | |
--Renter-Occupied | 13,883 | 209,794 | 533,077 | |
Owner-Occupied Values | < 100K | 448 | 3329 | 7957 |
100-199K | 413 | 4293 | 9002 | |
200-299K | 902 | 5990 | 13122 | |
300-399K | 1661 | 10787 | 19653 | |
400-499K | 4857 | 18122 | 27824 | |
500K+ | 11178 | 70067 | 177233 | |
Total Working Age Population | 80,107 | 694,945 | 1,720,282 | |
In Work Force | 50,827 | 429,620 | 1,080,986 | |
Not In Work Force | 29,279 | 265,326 | 639,296 | |
Workforce Employed | 47,712 | 401,292 | 1,013,635 | |
Workforce Unemployed | 3,090 | 28,132 | 66,852 | |
Civlian Workforce | 50,802 | 429,424 | 1,080,488 | |
Military Workforce | 25 | 196 | 499 | |
Total Households | 33,342 | 322,380 | 787,869 | |
Family Households | 25,190 | 209,658 | 500,185 | |
Non-Family Households | 8,152 | 112,722 | 287,684 | |
Married Couple | 14,064 | 119,481 | 303,450 | |
Other Family | 11,127 | 90,178 | 196,735 | |
Married w/Child | 5,430 | 51,834 | 136,848 | |
Single Male w/Child | 629 | 5,535 | 14,286 | |
Single Female w/Child | 3,109 | 28,403 | 62,588 |
Population Change Last Two Decades - Plus Projection
2000 | % | 2010 | % | 2020 | % | 2030 | |
---|---|---|---|---|---|---|---|
New Jersey | 8,414,350 | +4 | 8,791,894 | +4 | 9,132,700 | +4 | 9,530,900 |
Hudson County | 608,975 | +4 | 634,266 | +12 | 708,100 | +6 | 747,400 |
New York | 18,976,457 | +2 | 19,378,102 | +4 | 20,146,131 | +2 | 20,604,030 |
Kings County | 2,465,326 | +2 | 2,504,700 | +9 | 2,738,283 | +5 | 2,863,996 |
New York County | 1,537,195 | +3 | 1,585,873 | +6 | 1,688,894 | +2 | 1,727,631 |
Queens County | 2,229,379 | 0 | 2,230,722 | +9 | 2,436,549 | +5 | 2,565,268 |
Total Working Age Population:
Total Households:
Total Working Age Population:
Total Households:
Total Working Age Population:
Total Households: