Industrial Properties
SEC Roosevelt Rd Technology Blvd West Chicago, IL 60185
SEC Roosevelt Rd Technology Blvd West Chicago, IL 60185
Details & Description
Property Highlights
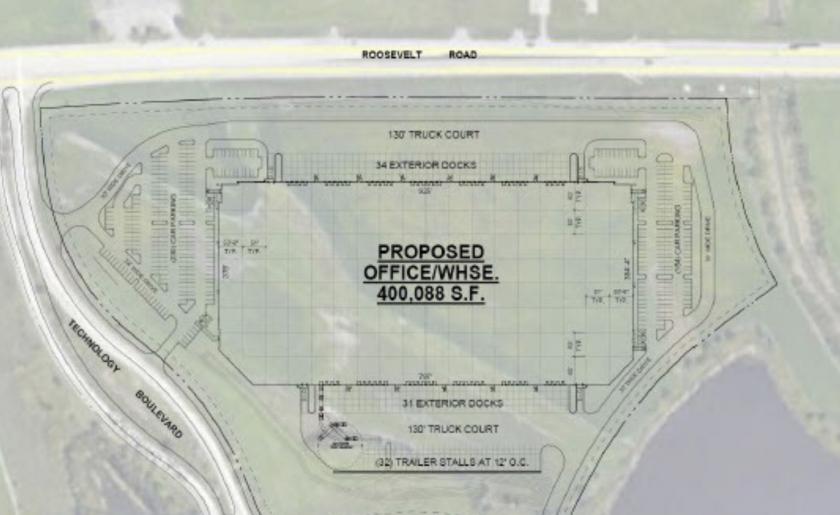
- • 400,088 SF DIvisible
- • Office To Suit
- • Bay Spacing 52 x 52
- • 40 Exterior Docks Expandable to 64
- • Fire Suppression ESFR
- • 280 Car Parking Expandable
Listing Agents

Mark Moran
O: 630-693-0656
mmoran@hiffman.com
O: 630-693-0656
mmoran@hiffman.com

John Whitehead
NAI Hiffman
O: 630-693-0643
jwhitehead@hiffman.com
NAI Hiffman
O: 630-693-0643
jwhitehead@hiffman.com
While we strive to provide the most accurate information, all listing information, and demographic data, is provided by third-parties. As such, MyEListing will not be responsible for the accuracy of the information. It is strongly recommended that you verify all information with the listing agent, and any relevant agencies, prior to making any decisions.