Commercial Land
910 Holcomb Bridge Road Roswell, GA 30076
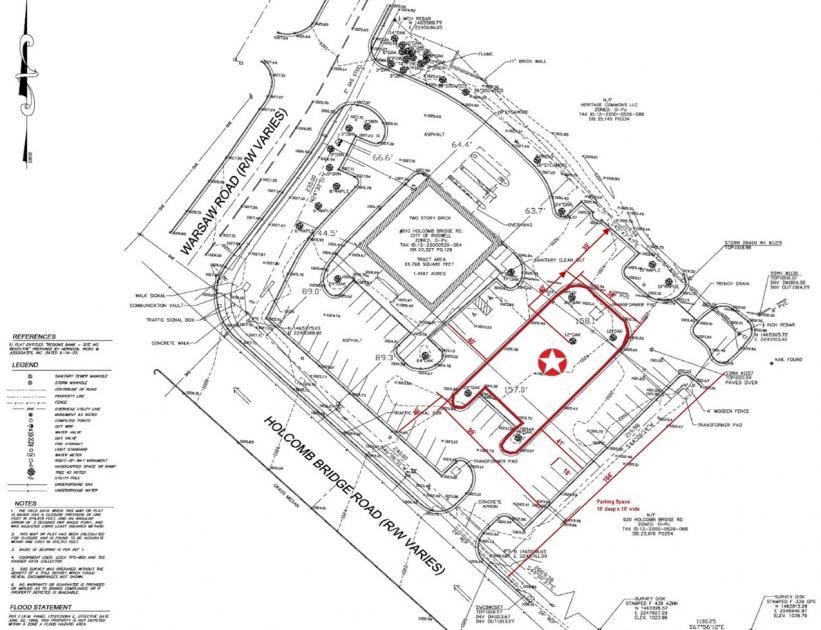
910 Holcomb Bridge Road Roswell, GA 30076

Details & Description
Property Highlights
- • Build-to-Suit or Ground Lease
- • Zoning OP Office ParkMedical
- • Rate TBD
- • City of Roswell
- • Excellent Location Visibility
Listing Agents

Jeff McMullen
O: 404-816-1600
M: 770-380-6538
jmcmullen@richardbowers.com
O: 404-816-1600
M: 770-380-6538
jmcmullen@richardbowers.com
While we strive to provide the most accurate information, all listing information, and demographic data, is provided by third-parties. As such, MyEListing will not be responsible for the accuracy of the information. It is strongly recommended that you verify all information with the listing agent, and any relevant agencies, prior to making any decisions.