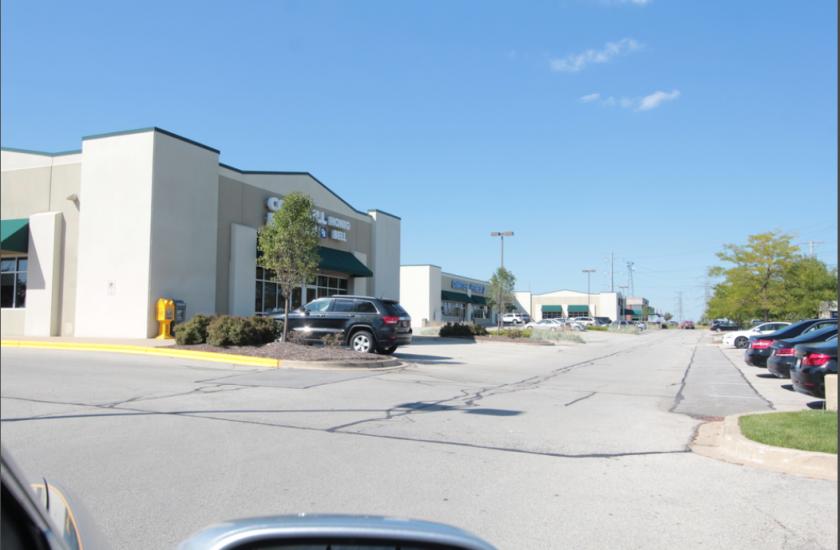
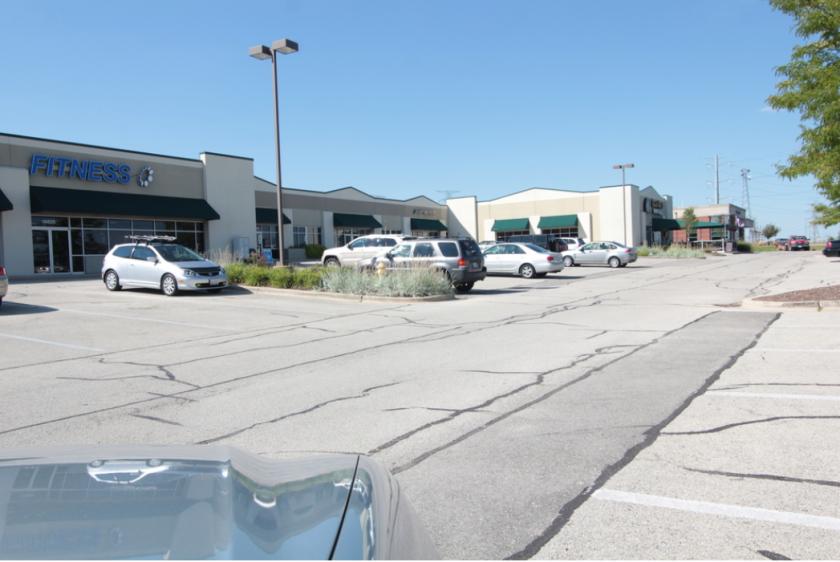
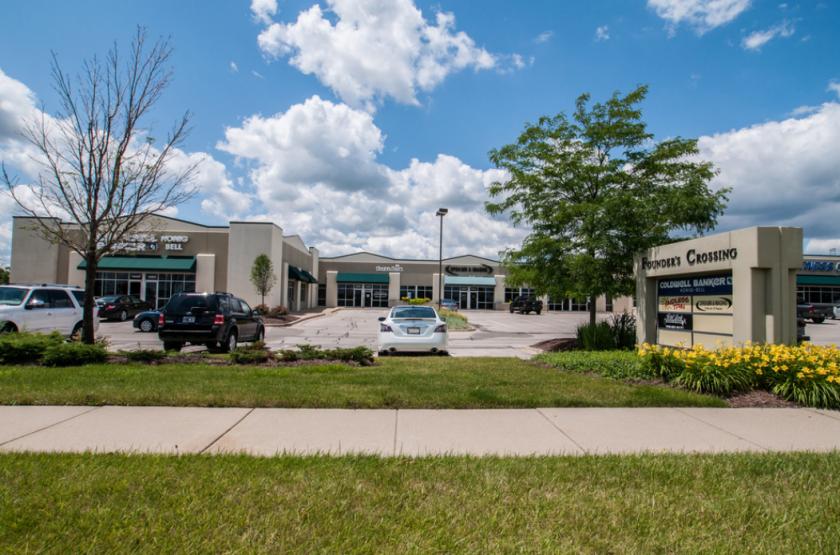
1-Mile | 3-Miles | 5-Miles | ||
---|---|---|---|---|
Total Population | 6,590 | 38,011 | 101,781 | |
Population Median Age | 41 | 41 | 42 | |
Population by Age | 0-9 Yrs | 715 (10%) | 4249 (11%) | 10967 (10%) |
10-19 Yrs | 976 (14%) | 5459 (14%) | 13477 (13%) | |
20-29 Yrs | 698 (10%) | 3583 (9%) | 10198 (10%) | |
30-39 Yrs | 662 (10%) | 4078 (10%) | 11128 (10%) | |
40-49 Yrs | 750 (11%) | 4537 (11%) | 12518 (12%) | |
50-59 Yrs | 878 (13%) | 6061 (15%) | 16505 (16%) | |
60-69 Yrs | 1082 (16%) | 5577 (14%) | 14173 (13%) | |
70+ Yrs | 828 (12%) | 4467 (11%) | 12814 (12%) | |
Median HH Income | $101,226 | $109,025 | $99,790 | |
Total Household Income | < 24K | 211 (9%) | 1041 (8%) | 3254 (9%) |
25-49K | 265 (12%) | 1550 (12%) | 5177 (14%) | |
50-74K | 328 (15%) | 1468 (11%) | 4416 (12%) | |
75-99K | 269 (12%) | 1771 (13%) | 5117 (14%) | |
100-199K | 828 (38%) | 4716 (37%) | 12537 (34%) | |
200K+ | 273 (12%) | 2169 (17%) | 5341 (14%) | |
Highest Education Level | No Diploma | 323 | 1693 | 4328 |
Diploma or GED | 1396 | 6515 | 17699 | |
Some College | 899 | 5023 | 13915 | |
Assoc. Degree | 454 | 2295 | 6199 | |
Bachelors Degree | 979 | 6955 | 18585 | |
Higher Degree | 501 | 3947 | 11583 | |
Total Housing Units | 2,229 | 13,081 | 37,369 | |
--Owner-Occupied | 1,998 | 11,737 | 31,186 | |
--Renter-Occupied | 177 | 977 | 4,656 | |
Owner-Occupied Values | < 100K | 51 | 254 | 825 |
100-199K | 49 | 535 | 3810 | |
200-299K | 784 | 3431 | 8293 | |
300-399K | 864 | 4035 | 9181 | |
400-499K | 177 | 1730 | 4835 | |
500K+ | 73 | 1753 | 4243 | |
Total Working Age Population | 5,221 | 30,349 | 82,148 | |
In Work Force | 3,492 | 19,889 | 53,246 | |
Not In Work Force | 1,729 | 10,460 | 28,902 | |
Workforce Employed | 3,333 | 19,098 | 51,148 | |
Workforce Unemployed | 159 | 791 | 2,090 | |
Civlian Workforce | 3,492 | 19,889 | 53,238 | |
Military Workforce | 0 | 0 | 7 | |
Total Households | 2,175 | 12,714 | 35,842 | |
Family Households | 1,722 | 10,180 | 27,334 | |
Non-Family Households | 453 | 2,534 | 8,509 | |
Married Couple | 1,534 | 9,149 | 23,726 | |
Other Family | 188 | 1,031 | 3,608 | |
Married w/Child | 557 | 3,556 | 9,003 | |
Single Male w/Child | 27 | 86 | 418 | |
Single Female w/Child | 62 | 369 | 1,225 |
Population Change Last Two Decades - Plus Projection
2000 | % | 2010 | % | 2020 | % | 2030 | |
---|---|---|---|---|---|---|---|
Illinois | 12,419,293 | +3 | 12,830,632 | +12 | 14,316,487 | +6 | 15,138,849 |
Cook County | 5,376,741 | -3 | 5,194,675 | +10 | 5,707,832 | +5 | 5,990,243 |
DuPage County | 904,161 | +1 | 916,924 | +10 | 1,010,323 | +2 | 1,034,039 |
Will County | 502,266 | +35 | 677,560 | +34 | 907,625 | +20 | 1,093,207 |
Total Working Age Population:
Total Households:
Total Working Age Population:
Total Households:
Total Working Age Population:
Total Households: