Multifamily Housing
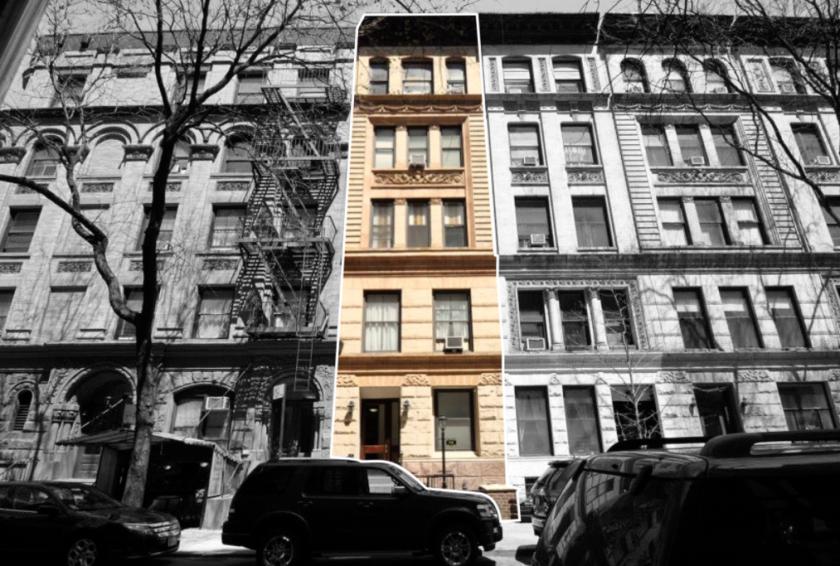
73 West 68th Street New York, NY 10023
73 West 68th Street New York, NY 10023
Details & Description
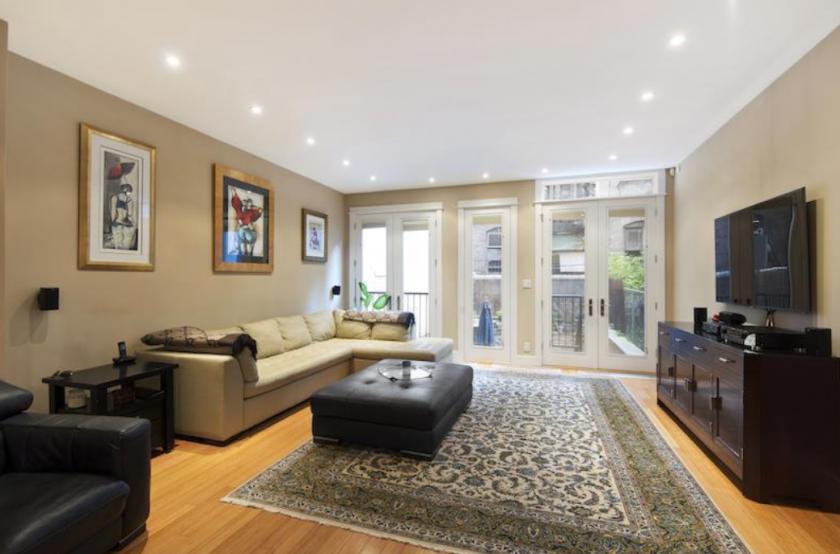
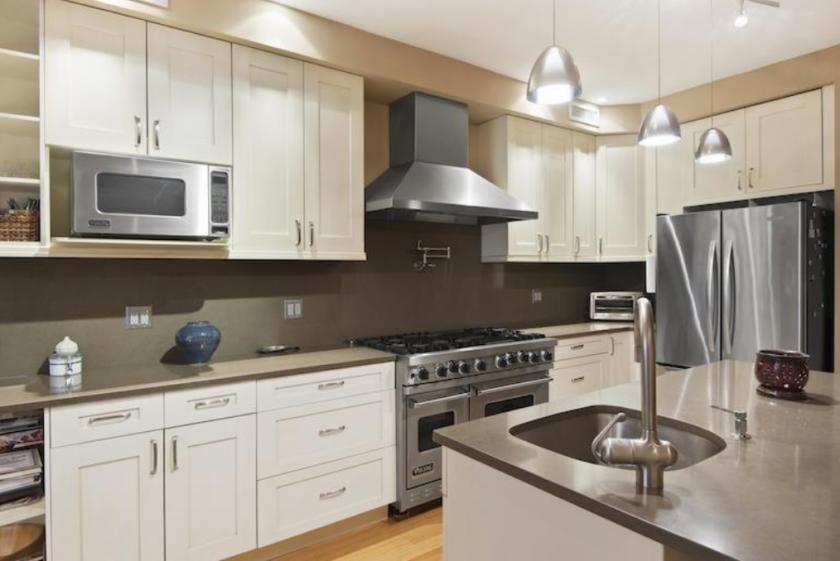
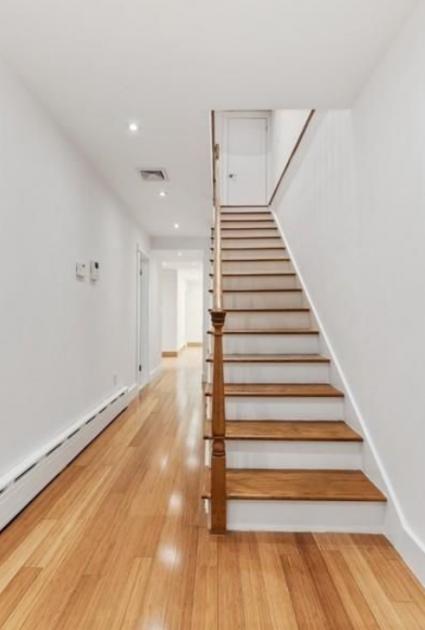
Additional Photos

Listing Agents

Chris Brodhead
O: 646-933-2616
cbrodhead@b6realestate.com
O: 646-933-2616
cbrodhead@b6realestate.com
While we strive to provide the most accurate information, all listing information, and demographic data, is provided by third-parties. As such, MyEListing will not be responsible for the accuracy of the information. It is strongly recommended that you verify all information with the listing agent, and any relevant agencies, prior to making any decisions.


