Industrial Properties
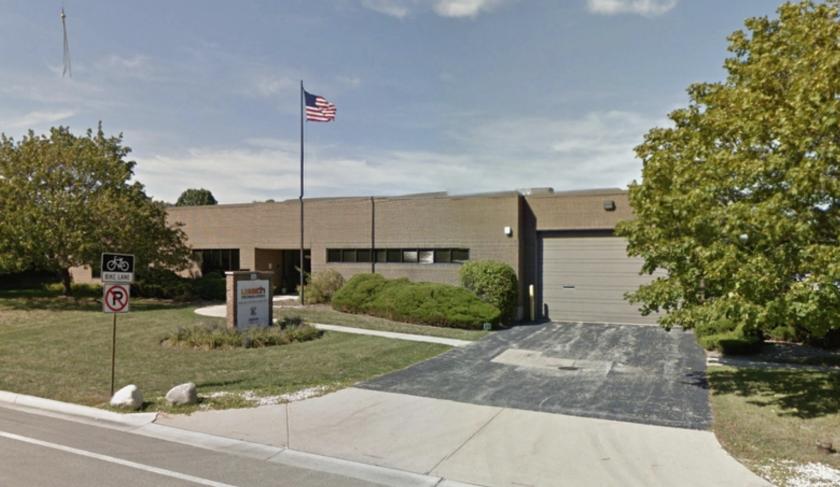
1524 Davis Road Elgin, IL 60123
1524 Davis Road Elgin, IL 60123
Details & Description
Property Highlights
- • 33,724 SF - DIVISIBLE
- • Approximately 2.44 AC 106,374 SF
- • 186 - 196 clear heights
- • Floor drains
- • 1 drive-in door
- • 10,075 SF office
Listing Agents

Bruce Granger
O: 630-693-0648
M: 708-987-0811
bgranger@hiffman.com
O: 630-693-0648
M: 708-987-0811
bgranger@hiffman.com
While we strive to provide the most accurate information, all listing information, and demographic data, is provided by third-parties. As such, MyEListing will not be responsible for the accuracy of the information. It is strongly recommended that you verify all information with the listing agent, and any relevant agencies, prior to making any decisions.


