Commercial Land
191st Ave Mokena, IL 60448
191st Ave Mokena, IL 60448
Details & Description
Property Highlights
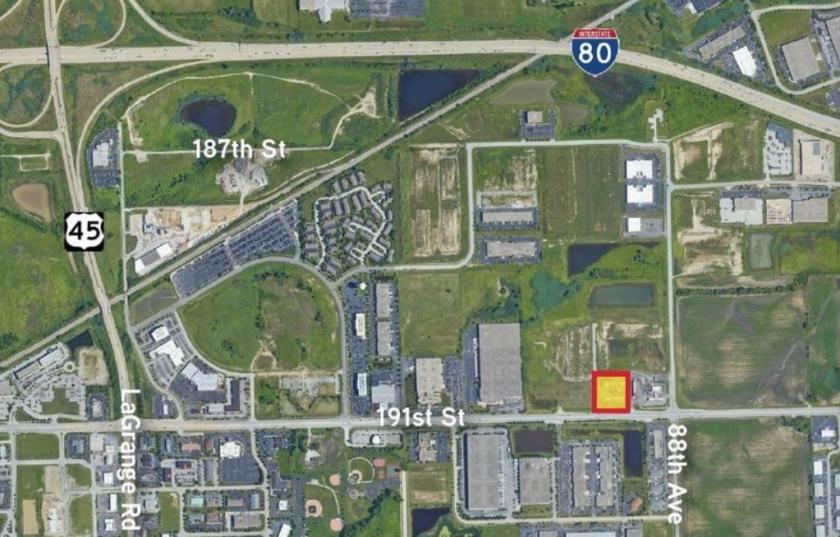
- • Frontage along 88th Ave
- • Fully lighted intersection at corner of 191st88th
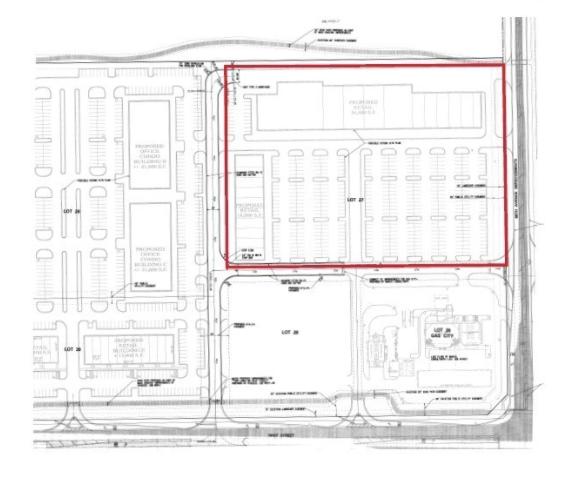
- • Flexible C1-A zoning
- • Half mile from I-80 Rt. 45 full interchange
- • Lots are net of detention
Listing Agents

John Basile
O: 630-693-0641
M: 708-539-6398
jbasile@hiffman.com
O: 630-693-0641
M: 708-539-6398
jbasile@hiffman.com
While we strive to provide the most accurate information, all listing information, and demographic data, is provided by third-parties. As such, MyEListing will not be responsible for the accuracy of the information. It is strongly recommended that you verify all information with the listing agent, and any relevant agencies, prior to making any decisions.