Office Space
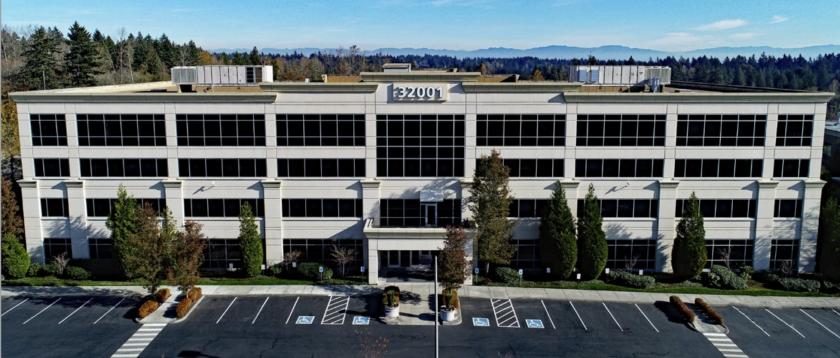
32001 32nd Avenue South Federal Way, WA 98001
32001 32nd Avenue South Federal Way, WA 98001
Details & Description
Property Highlights
- • Mount Rainier views
- • Two private balconies
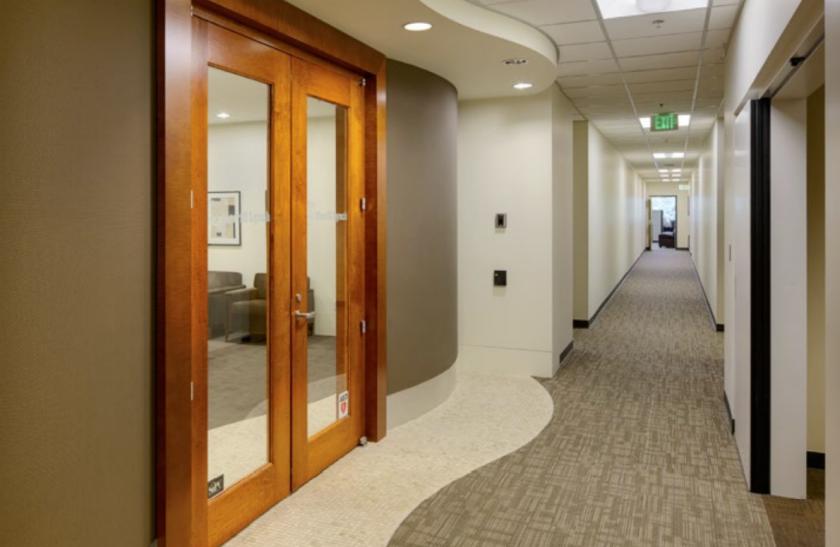
- • Private offices
- • Large conference room,
- • Large open work areas
- • Reception area
Listing Agents

Mike Hemphill
O: 206-336-5325
mhemphill@andoverco.com
O: 206-336-5325
mhemphill@andoverco.com

Veronika Zwicke
The Andover Company Inc.
O: 206-336-5335
vzwicke@andoverco.com
The Andover Company Inc.
O: 206-336-5335
vzwicke@andoverco.com
While we strive to provide the most accurate information, all listing information, and demographic data, is provided by third-parties. As such, MyEListing will not be responsible for the accuracy of the information. It is strongly recommended that you verify all information with the listing agent, and any relevant agencies, prior to making any decisions.