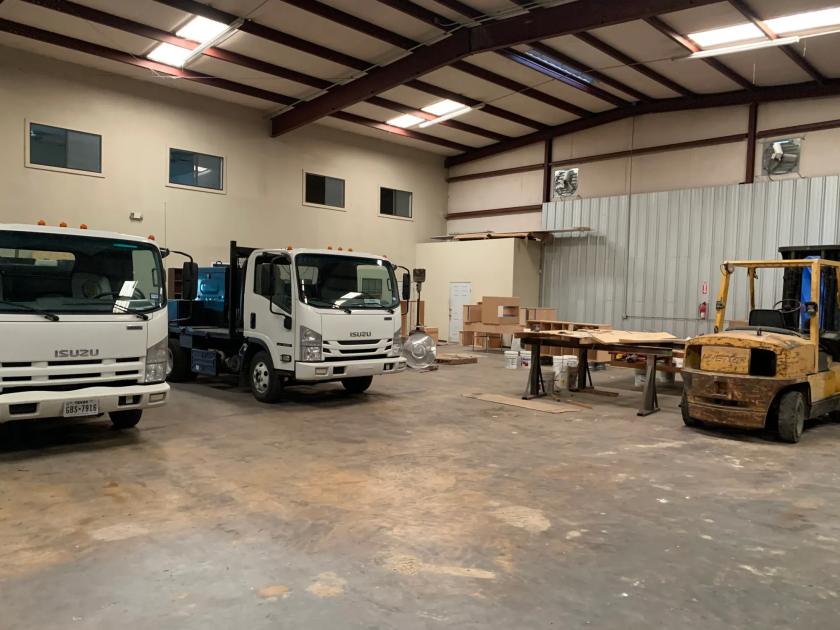
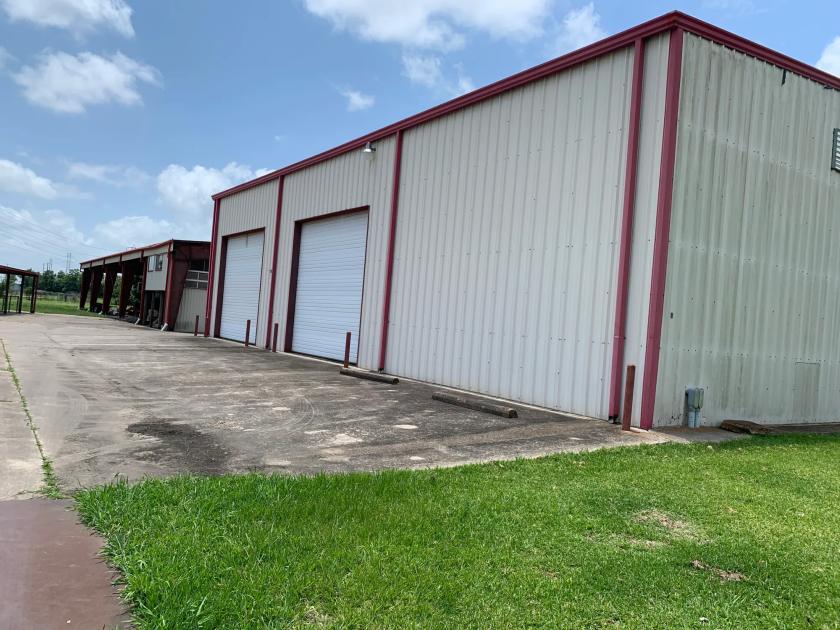
Commercial Land
10700 Hartsook Street Houston, TX 77034
10700 Hartsook Street Houston, TX 77034
Details & Description
Property Highlights
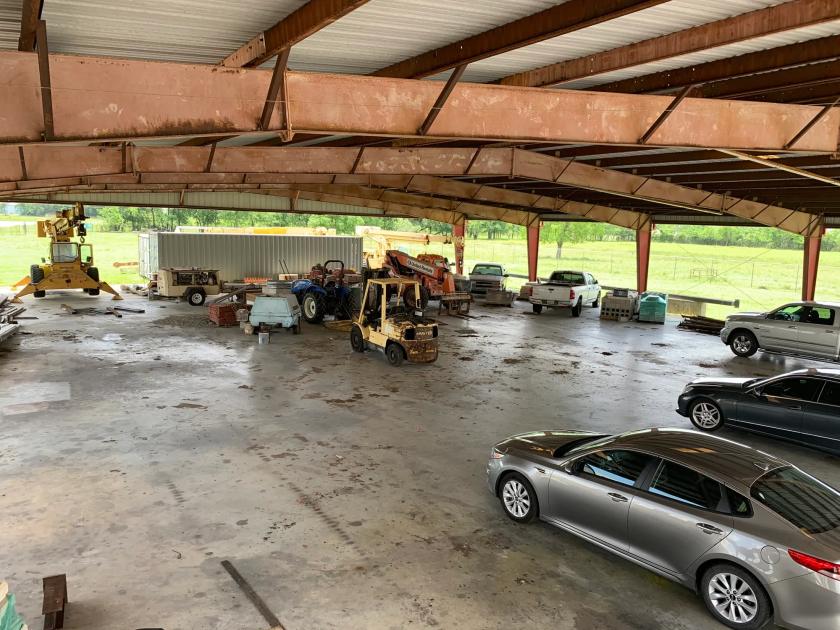
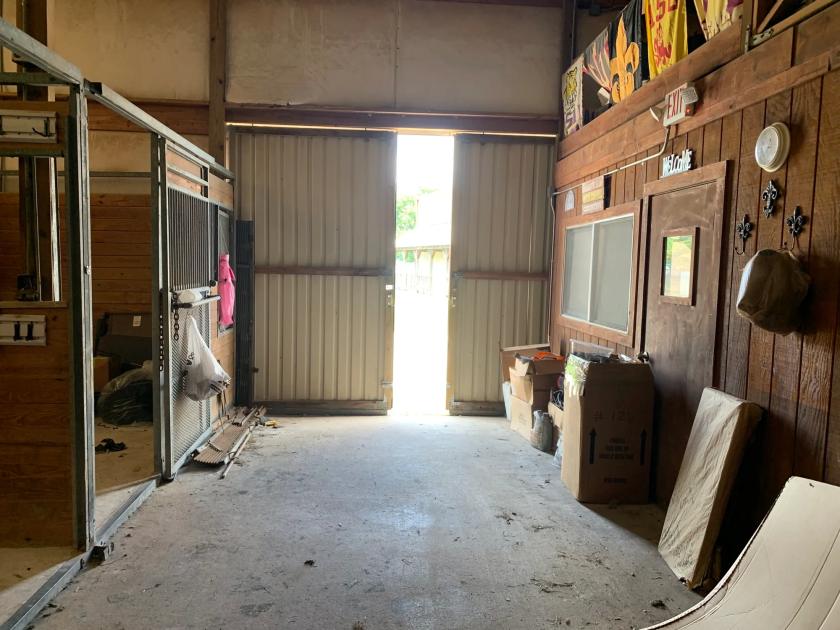
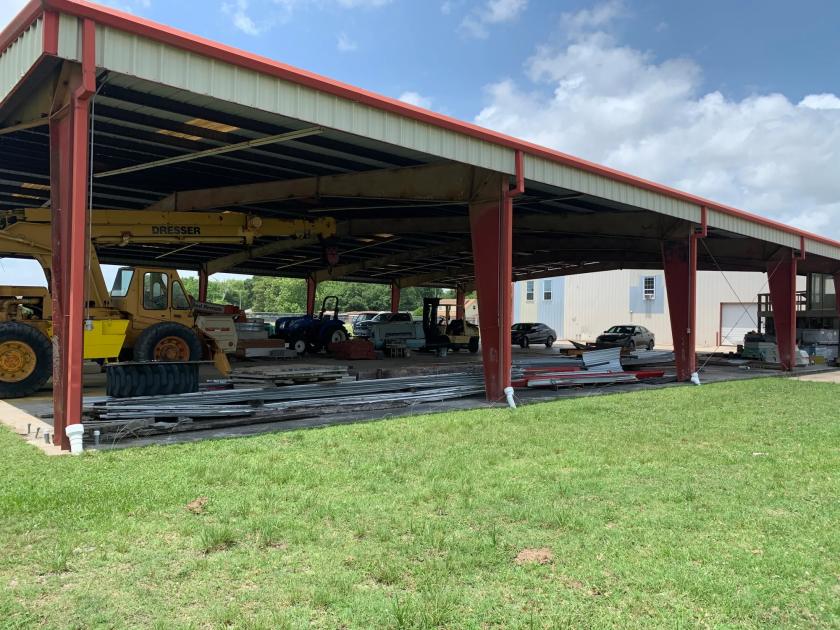
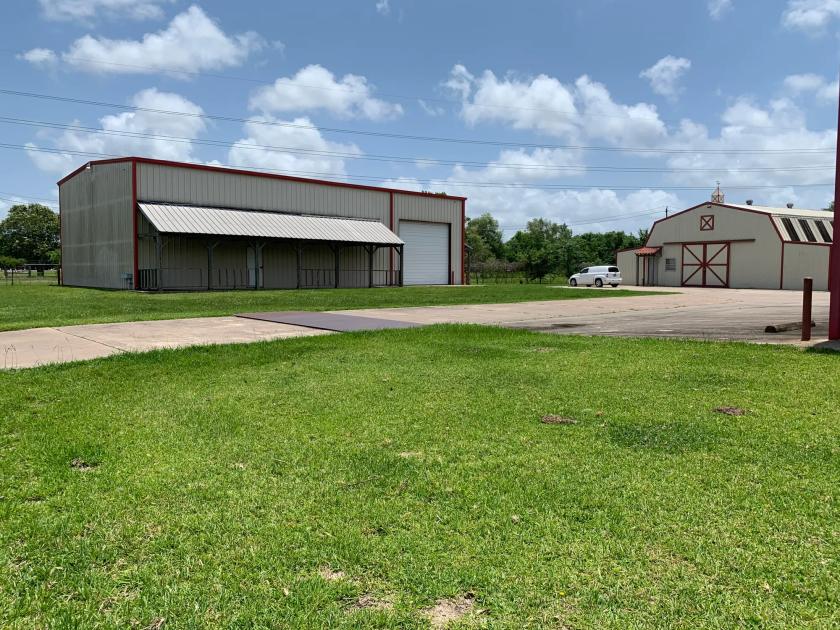
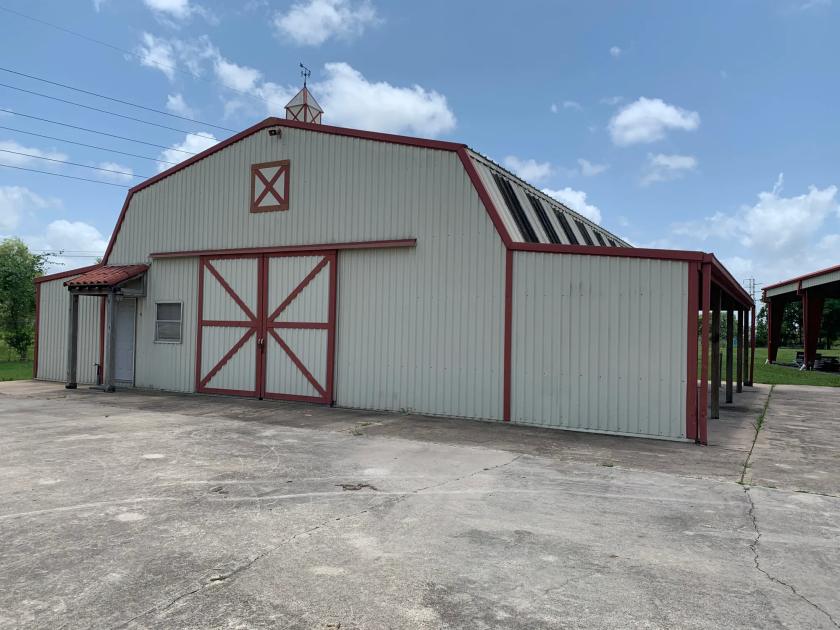
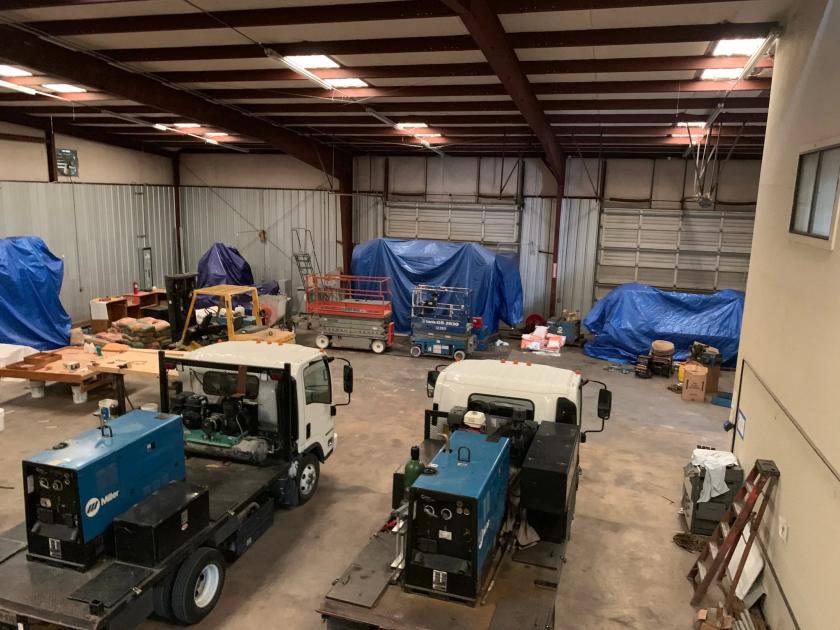
- • 28,000 SF with a 14,000 SF Metal Canopy
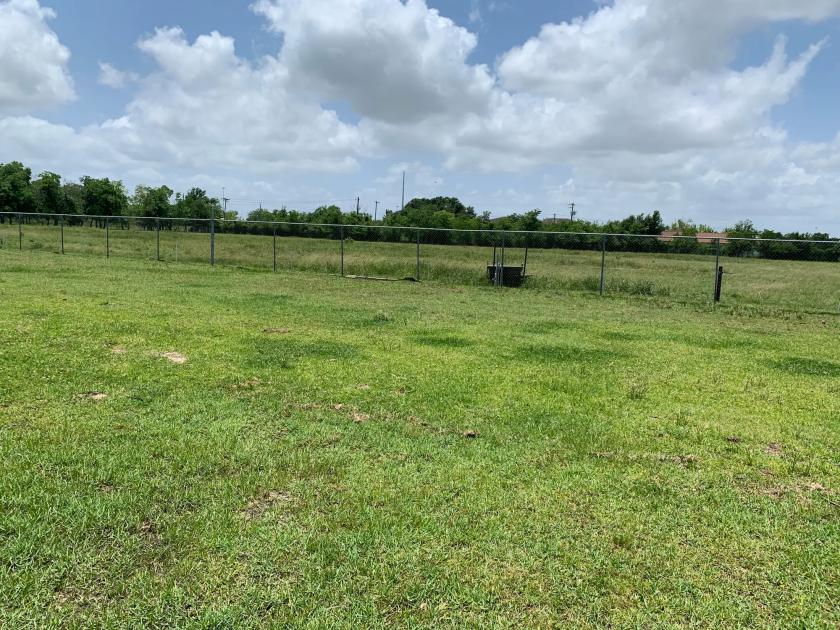
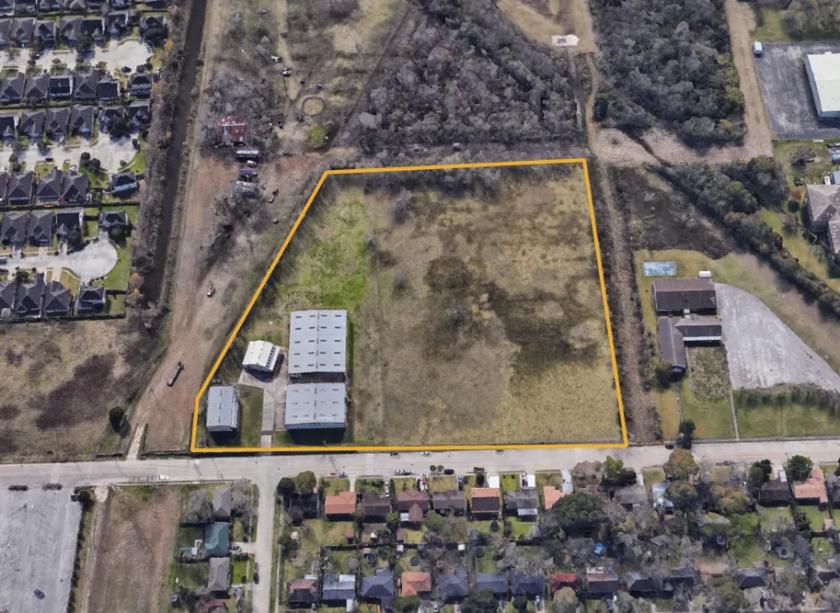
- • 9.3 Acres
- • Fully Fenced
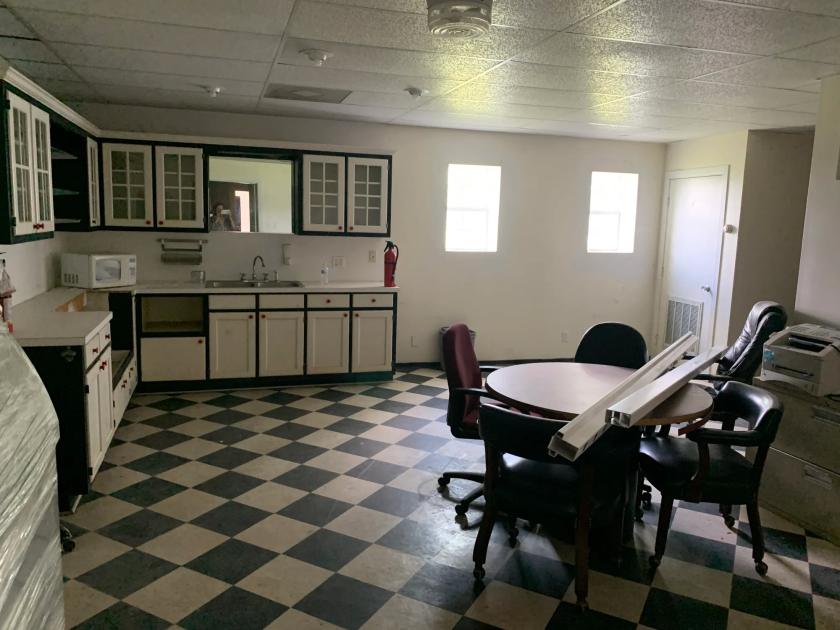
- • City Water Included
- • 480V Phase 3
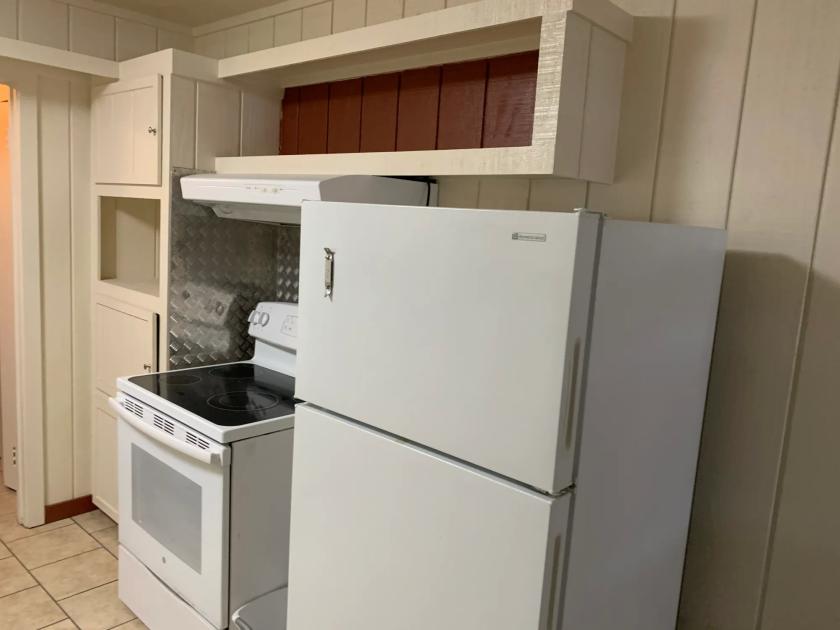
Additional Photos
Listing Agents

Matthew Goldsby
O: 713-332-8220
matthewg@belvoir.net
O: 713-332-8220
matthewg@belvoir.net
While we strive to provide the most accurate information, all listing information, and demographic data, is provided by third-parties. As such, MyEListing will not be responsible for the accuracy of the information. It is strongly recommended that you verify all information with the listing agent, and any relevant agencies, prior to making any decisions.