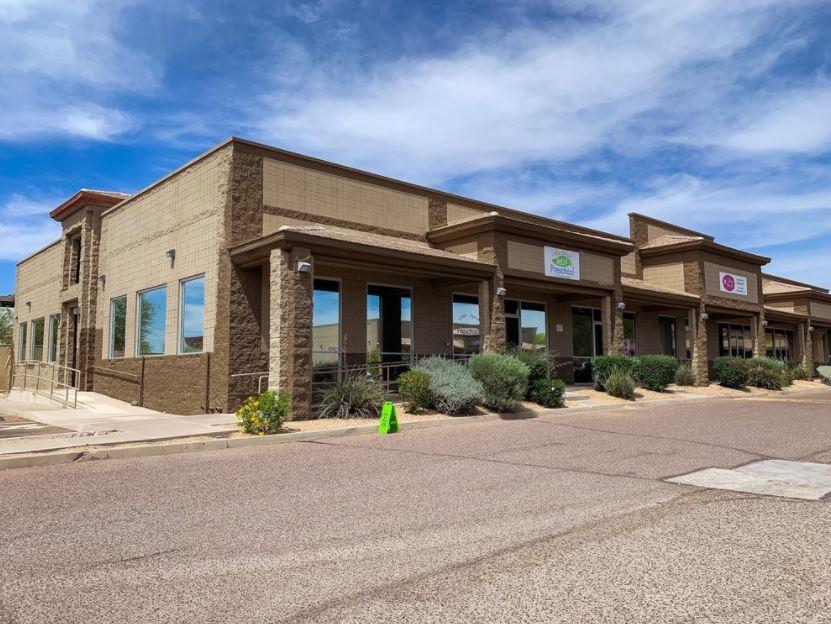
Retail Space
21031 North Cave Creek Road Phoenix, AZ 85024
21031 North Cave Creek Road Phoenix, AZ 85024
Details & Description
Property Highlights
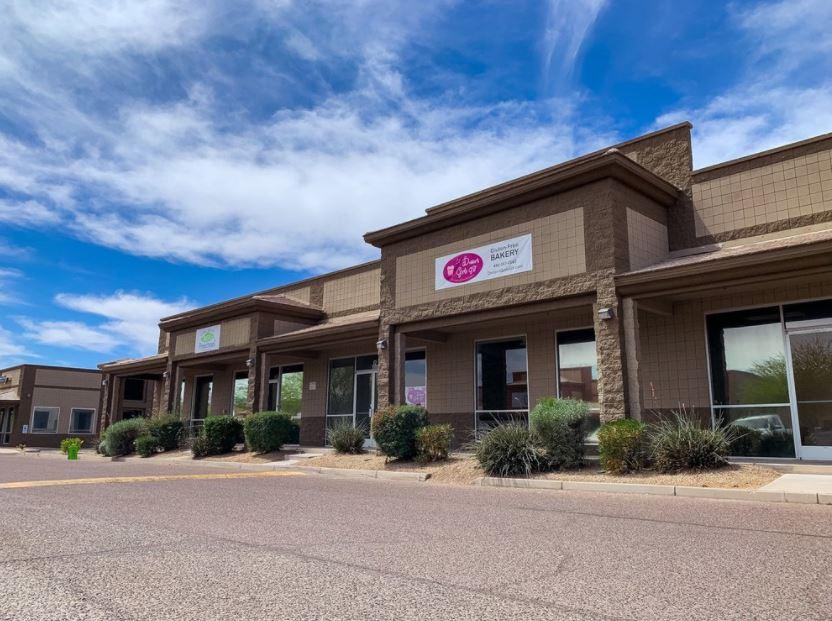
• Current Tenants Desert Girls Gluten Free and Little Sprout Preschool
• Month to month income in place -- Possible long term extensions
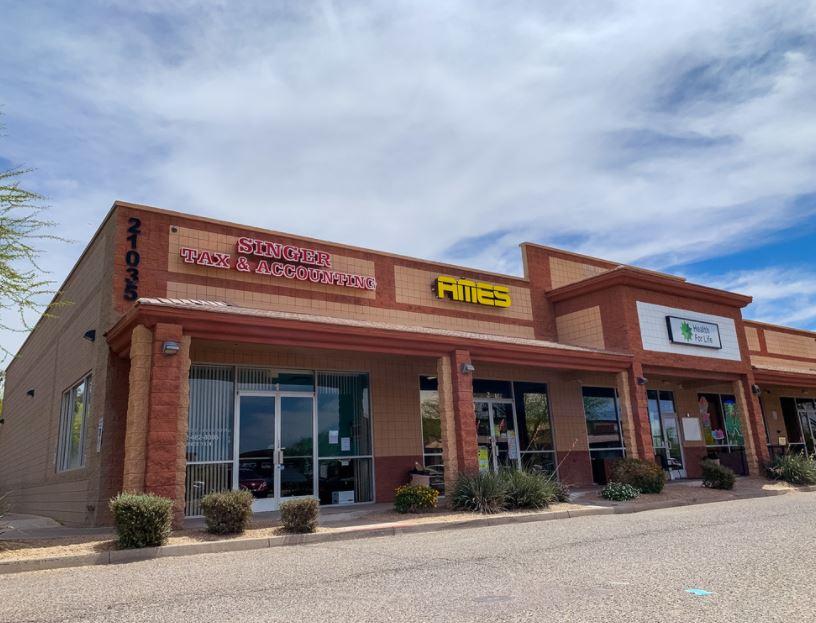
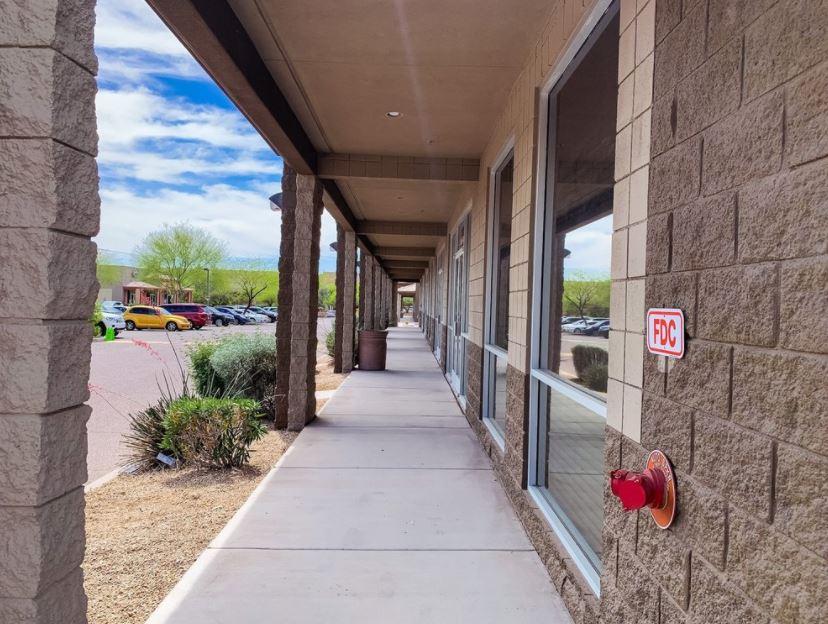
Additional Photos

Listing Agents

Franklin Connell
O: 602-386-1247
M: 480-201-0877
fconnell@cutlercommercial.com
O: 602-386-1247
M: 480-201-0877
fconnell@cutlercommercial.com
While we strive to provide the most accurate information, all listing information, and demographic data, is provided by third-parties. As such, MyEListing will not be responsible for the accuracy of the information. It is strongly recommended that you verify all information with the listing agent, and any relevant agencies, prior to making any decisions.


