Industrial Properties
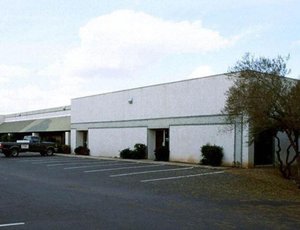
127 West Juanita Avenue Mesa, AZ 85210
127 West Juanita Avenue Mesa, AZ 85210

Details & Description
Listing Agents

Bradley Burress
O: 602-386-1250
M: 480-510-9434
bburress@cutlercommercial.com
O: 602-386-1250
M: 480-510-9434
bburress@cutlercommercial.com
While we strive to provide the most accurate information, all listing information, and demographic data, is provided by third-parties. As such, MyEListing will not be responsible for the accuracy of the information. It is strongly recommended that you verify all information with the listing agent, and any relevant agencies, prior to making any decisions.