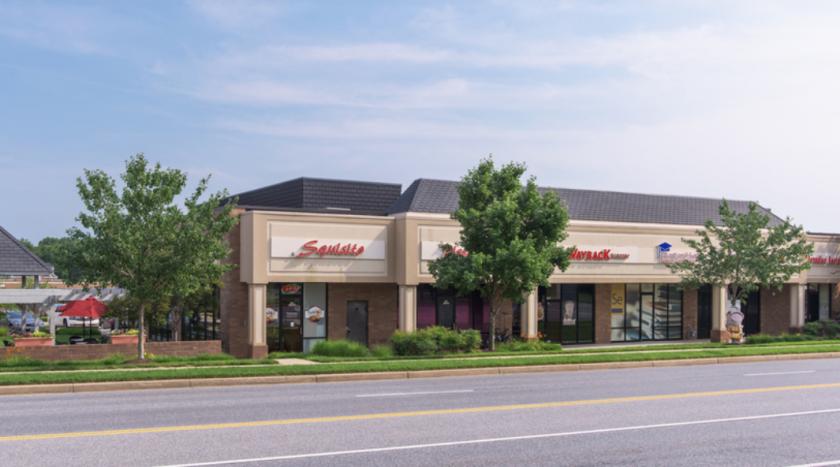
Retail Space
2641 Riva Road Annapolis, MD 21401
2641 Riva Road Annapolis, MD 21401
Details & Description
Property Highlights
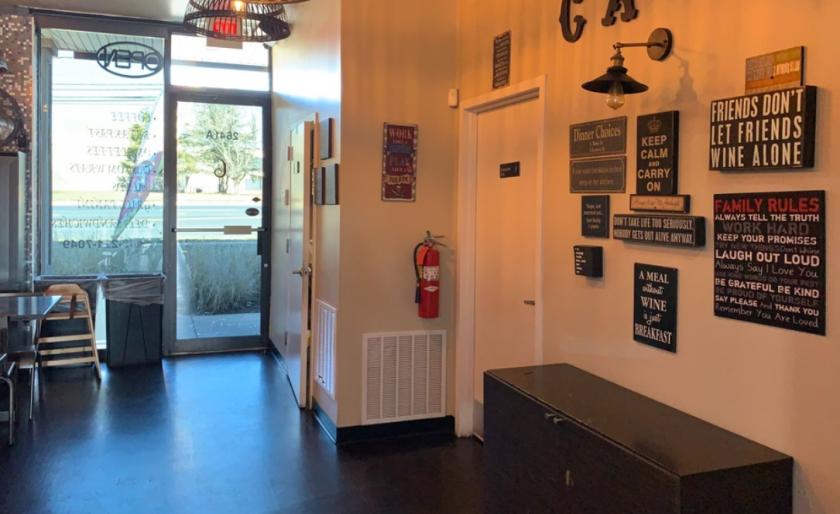
- • Modern, Clean Finishes
- • Sale includes all the FFE
- • Includes Full Liquor License
- • Across from Anne Arundel County Government Offices
- • Huge Breakfast, Lunch and Delivery Business
Listing Agents

Laurie Murphy-Zuiderhof
O: 443-756-5102
M: 443-756-5102
lmzuiderhof@murphycre.com
O: 443-756-5102
M: 443-756-5102
lmzuiderhof@murphycre.com
While we strive to provide the most accurate information, all listing information, and demographic data, is provided by third-parties. As such, MyEListing will not be responsible for the accuracy of the information. It is strongly recommended that you verify all information with the listing agent, and any relevant agencies, prior to making any decisions.