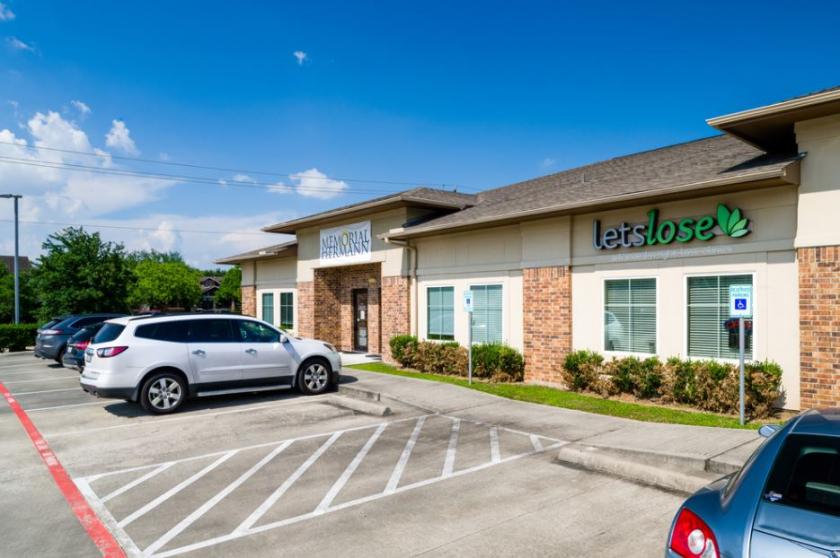
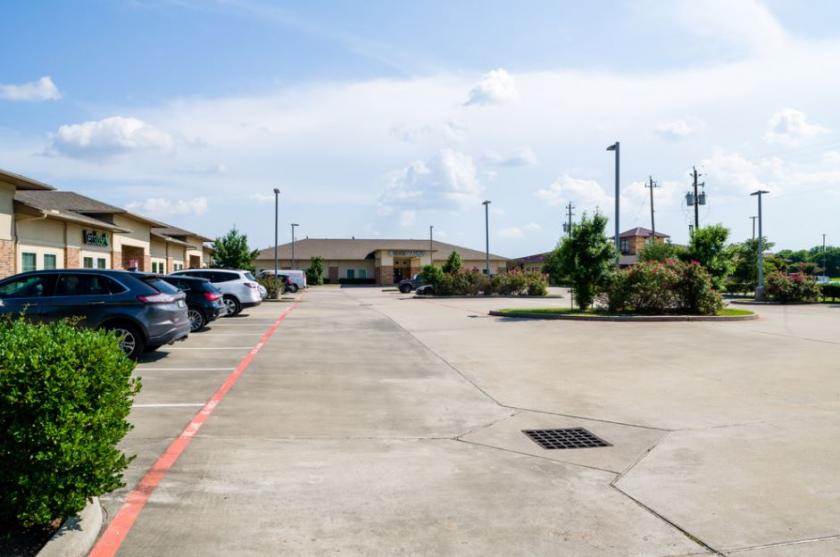
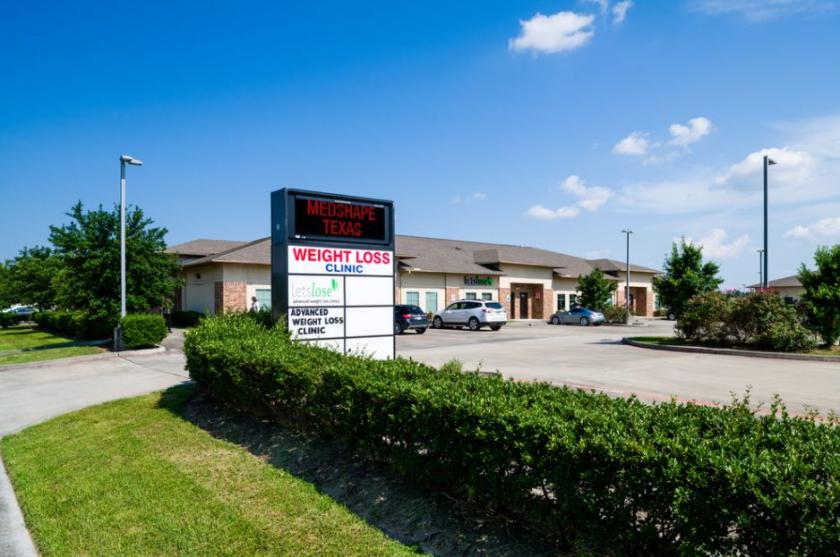
1-Mile | 3-Miles | 5-Miles | ||
---|---|---|---|---|
Total Population | 7,136 | 79,244 | 292,454 | |
Population Median Age | 38 | 35 | 34 | |
Population by Age | 0-9 Yrs | 878 (12%) | 11920 (15%) | 45218 (15%) |
10-19 Yrs | 889 (12%) | 12822 (16%) | 47338 (16%) | |
20-29 Yrs | 1033 (14%) | 11620 (14%) | 44594 (15%) | |
30-39 Yrs | 922 (12%) | 10573 (13%) | 40353 (13%) | |
40-49 Yrs | 904 (12%) | 10124 (12%) | 36213 (12%) | |
50-59 Yrs | 1104 (15%) | 9623 (12%) | 34409 (11%) | |
60-69 Yrs | 760 (10%) | 6987 (8%) | 25294 (8%) | |
70+ Yrs | 646 (9%) | 5576 (7%) | 19036 (6%) | |
Median HH Income | $77,370 | $61,964 | $59,952 | |
Total Household Income | < 24K | 292 (11%) | 4669 (17%) | 16252 (17%) |
25-49K | 465 (17%) | 5988 (22%) | 22283 (23%) | |
50-74K | 512 (19%) | 5092 (19%) | 18565 (19%) | |
75-99K | 378 (14%) | 3659 (13%) | 12637 (13%) | |
100-199K | 823 (31%) | 5939 (22%) | 19573 (20%) | |
200K+ | 140 (5%) | 1188 (4%) | 4592 (4%) | |
Highest Education Level | No Diploma | 557 | 8891 | 41331 |
Diploma or GED | 1843 | 15829 | 53040 | |
Some College | 1039 | 10877 | 36843 | |
Assoc. Degree | 471 | 3908 | 12586 | |
Bachelors Degree | 714 | 6310 | 22085 | |
Higher Degree | 320 | 2935 | 11585 | |
Total Housing Units | 2,853 | 28,992 | 102,211 | |
--Owner-Occupied | 1,671 | 14,937 | 53,211 | |
--Renter-Occupied | 937 | 11,599 | 40,691 | |
Owner-Occupied Values | < 100K | 121 | 2977 | 13056 |
100-199K | 1003 | 7300 | 26089 | |
200-299K | 483 | 3431 | 9248 | |
300-399K | 50 | 747 | 2538 | |
400-499K | 7 | 205 | 1156 | |
500K+ | 7 | 277 | 1125 | |
Total Working Age Population | 5,735 | 59,557 | 218,830 | |
In Work Force | 3,786 | 39,904 | 146,525 | |
Not In Work Force | 1,949 | 19,652 | 72,305 | |
Workforce Employed | 3,590 | 36,579 | 134,481 | |
Workforce Unemployed | 195 | 3,309 | 11,940 | |
Civlian Workforce | 3,786 | 39,887 | 146,421 | |
Military Workforce | 0 | 17 | 103 | |
Total Households | 2,609 | 26,535 | 93,902 | |
Family Households | 1,991 | 19,157 | 69,864 | |
Non-Family Households | 618 | 7,378 | 24,038 | |
Married Couple | 1,406 | 12,774 | 47,038 | |
Other Family | 585 | 6,383 | 22,826 | |
Married w/Child | 545 | 6,136 | 22,552 | |
Single Male w/Child | 39 | 794 | 2,766 | |
Single Female w/Child | 170 | 2,583 | 9,047 |
Population Change Last Two Decades - Plus Projection
2000 | % | 2010 | % | 2020 | % | 2030 | |
---|---|---|---|---|---|---|---|
Texas | 20,851,820 | +21 | 25,145,561 | +18 | 29,677,668 | +18 | 34,894,452 |
Brazoria County | 241,767 | +30 | 313,166 | +20 | 375,869 | +20 | 452,517 |
Galveston County | 250,158 | +16 | 291,309 | +22 | 355,196 | +20 | 427,028 |
Harris County | 3,400,578 | +20 | 4,092,459 | +22 | 4,978,845 | +19 | 5,924,750 |
Total Working Age Population:
Total Households:
Total Working Age Population:
Total Households:
Total Working Age Population:
Total Households: