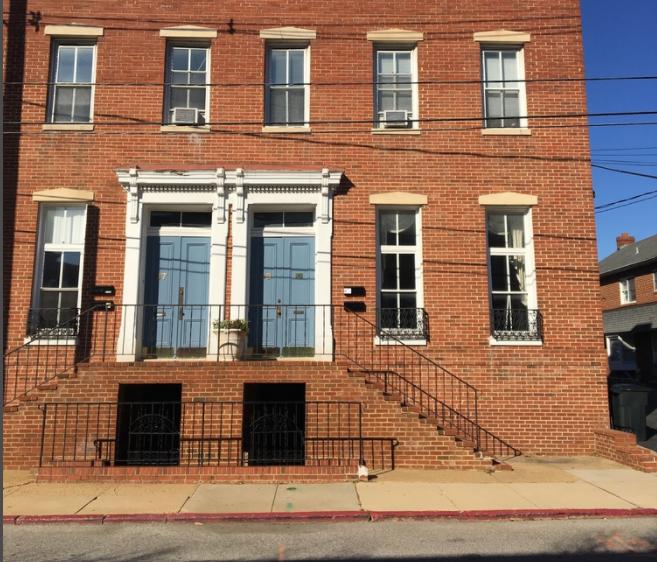
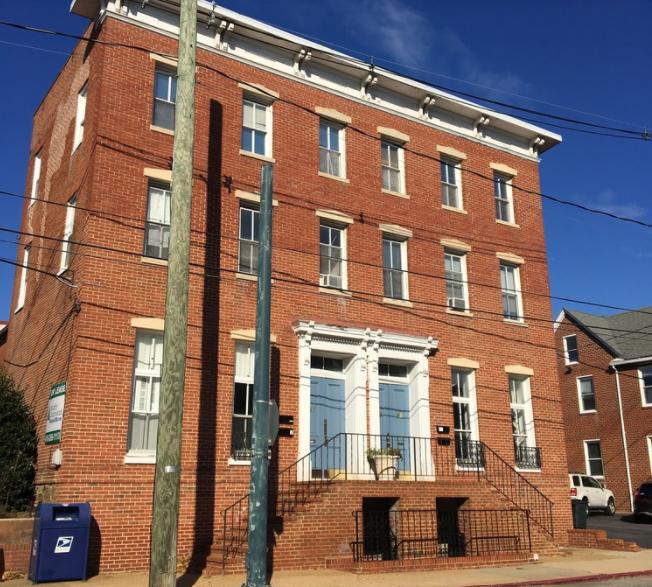
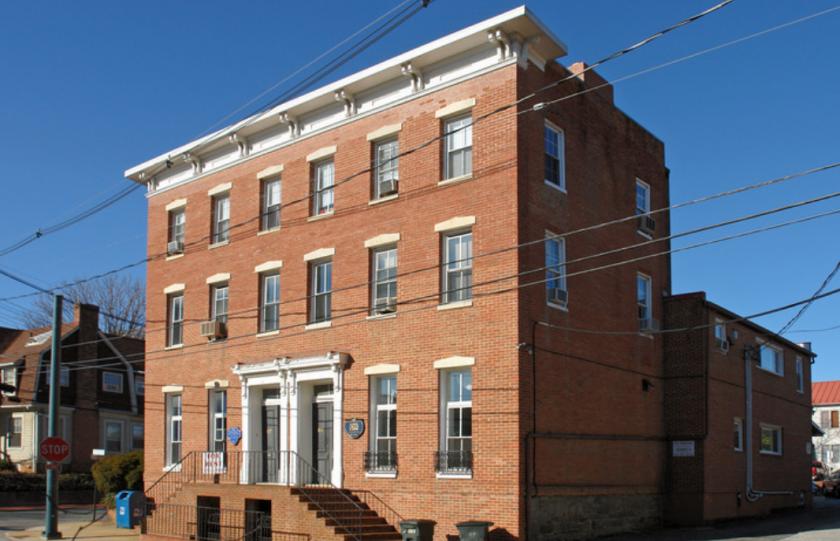
1-Mile | 3-Miles | 5-Miles | ||
---|---|---|---|---|
Total Population | 23,901 | 76,812 | 136,875 | |
Population Median Age | 34 | 38 | 40 | |
Population by Age | 0-9 Yrs | 1513 (6%) | 8280 (10%) | 14910 (10%) |
10-19 Yrs | 4013 (16%) | 9425 (12%) | 16379 (11%) | |
20-29 Yrs | 8039 (33%) | 15183 (19%) | 20663 (15%) | |
30-39 Yrs | 2312 (9%) | 9827 (12%) | 16874 (12%) | |
40-49 Yrs | 1835 (7%) | 8191 (10%) | 15945 (11%) | |
50-59 Yrs | 2225 (9%) | 9604 (12%) | 18779 (13%) | |
60-69 Yrs | 2273 (9%) | 8417 (10%) | 16884 (12%) | |
70+ Yrs | 1691 (7%) | 7887 (10%) | 16440 (12%) | |
Median HH Income | $97,337 | $100,618 | $108,260 | |
Total Household Income | < 24K | 1085 (15%) | 2863 (10%) | 4267 (8%) |
25-49K | 885 (12%) | 3838 (13%) | 6306 (12%) | |
50-74K | 675 (9%) | 3622 (13%) | 6635 (12%) | |
75-99K | 923 (13%) | 3493 (12%) | 6858 (13%) | |
100-199K | 1893 (27%) | 8202 (29%) | 16760 (32%) | |
200K+ | 1478 (21%) | 5748 (20%) | 11118 (21%) | |
Highest Education Level | No Diploma | 767 | 3997 | 5927 |
Diploma or GED | 1987 | 8050 | 15221 | |
Some College | 1933 | 7215 | 15042 | |
Assoc. Degree | 707 | 3100 | 6296 | |
Bachelors Degree | 3425 | 14647 | 27976 | |
Higher Degree | 3607 | 12996 | 23701 | |
Total Housing Units | 7,858 | 30,426 | 56,543 | |
--Owner-Occupied | 3,619 | 16,510 | 36,510 | |
--Renter-Occupied | 3,322 | 11,255 | 15,433 | |
Owner-Occupied Values | < 100K | 36 | 207 | 476 |
100-199K | 178 | 1176 | 1779 | |
200-299K | 247 | 2149 | 5011 | |
300-399K | 252 | 2429 | 6348 | |
400-499K | 577 | 2464 | 6068 | |
500K+ | 2328 | 8085 | 16828 | |
Total Working Age Population | 21,533 | 64,030 | 112,807 | |
In Work Force | 16,630 | 47,007 | 80,330 | |
Not In Work Force | 4,903 | 17,023 | 32,478 | |
Workforce Employed | 8,896 | 36,593 | 68,047 | |
Workforce Unemployed | 543 | 1,630 | 3,027 | |
Civlian Workforce | 9,439 | 38,222 | 71,074 | |
Military Workforce | 7,192 | 8,785 | 9,256 | |
Total Households | 6,940 | 27,766 | 51,943 | |
Family Households | 4,020 | 16,740 | 33,037 | |
Non-Family Households | 2,920 | 11,025 | 18,906 | |
Married Couple | 3,065 | 12,961 | 26,295 | |
Other Family | 955 | 3,780 | 6,742 | |
Married w/Child | 885 | 4,732 | 9,759 | |
Single Male w/Child | 96 | 450 | 1,014 | |
Single Female w/Child | 407 | 1,597 | 2,480 |
Population Change Last Two Decades - Plus Projection
2000 | % | 2010 | % | 2020 | % | 2030 | |
---|---|---|---|---|---|---|---|
Maryland | 5,296,486 | +9 | 5,773,552 | +6 | 6,141,900 | +6 | 6,518,750 |
Anne Arundel County | 489,656 | +10 | 537,656 | +7 | 573,250 | +4 | 596,700 |
Queen Annes County | 40,563 | +18 | 47,798 | +6 | 50,750 | +10 | 55,750 |
Talbot County | 33,812 | +12 | 37,782 | +3 | 38,850 | +5 | 40,900 |
Total Working Age Population:
Total Households:
Total Working Age Population:
Total Households:
Total Working Age Population:
Total Households: