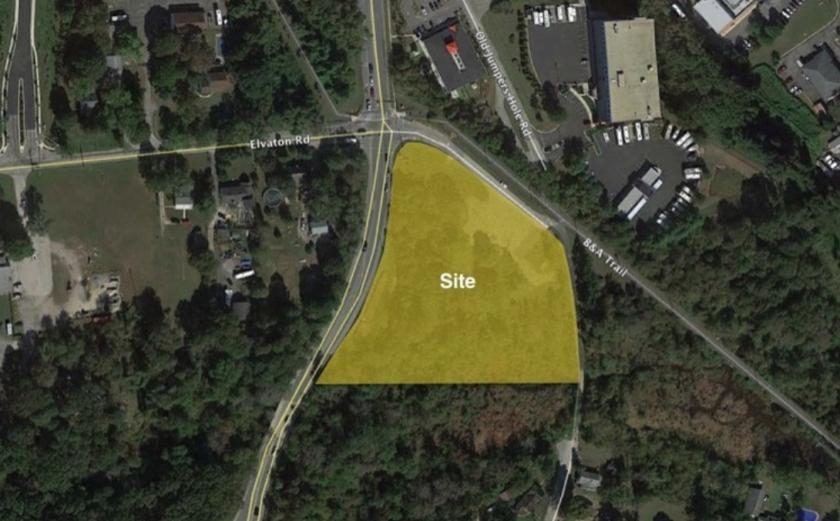
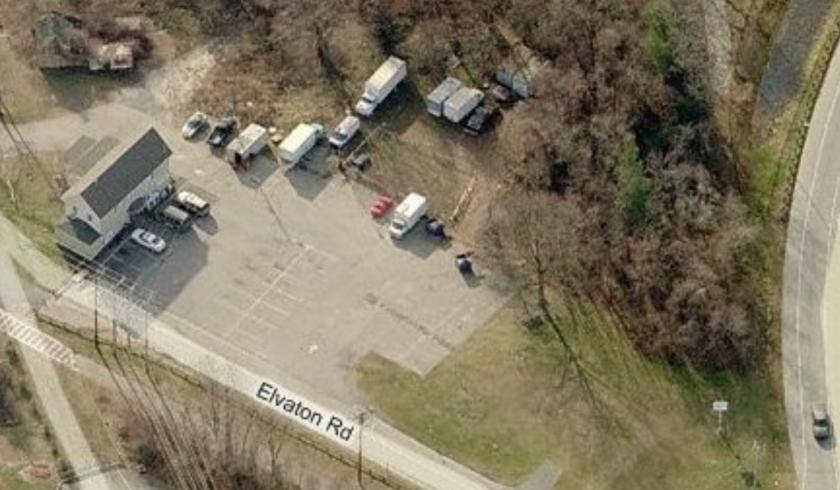
Located at the Intersection of Elevation and Jumpers Hole
Previous Engineering Due Diligence Report Available
16,000 SF Two-Story Structure
Zoning Supports a Variety of Development Opportunities
Preliminary Engineering Indicates that the Site can Support
8,000 SF Single Story Structure
Located at the Intersection of Elevation and Jumpers Hole
Zoning Supports a Variety of Development Opportunities
Previous Engineering Due Diligence Report Available
Preliminary Engineering Indicates that the Site can Support:
*16,000 SF Two-Story Structure
*8,000 SF Single Story Structure
Permitted Uses Including:
*Pharmacy, Child Care, Restaurants, Professional Office, Convenience Stores and Much More
No part of this information may be copied, reproduced, repurposed, or screen-captured for any commercial purpose without prior written authorization from MyEListing.
While we strive to provide the most accurate information, all listing information, and demographic data, is provided by third-parties. As such, MyEListing will not be responsible for the accuracy of the information. It is strongly recommended that you verify all information with the listing agent, and any relevant agencies, prior to making any decisions.
What is the asking price for 8450 Elvaton Road in Millersville?
The asking price for 8450 Elvaton Road is $955,000
How much land does the Millersville, MD property at 8450 Elvaton Road include?
8450 Elvaton Road in Millersville includes 3.100 acres of land
What is the population within 1 mile of 8450 Elvaton Road in Millersville?
The population within 1 mile of 8450 Elvaton Road Millersville, MD 21108 is 5,597 people.
Who do I contact for questions about 8450 Elvaton Road?
You should contact the listing agent,
Dennis Murphy, for any details regarding this commercial listing.