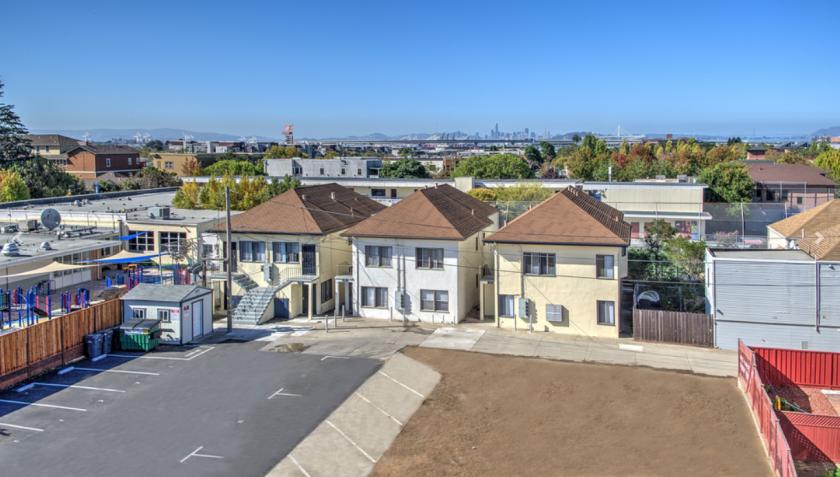
Multifamily Housing
1049 43rd Street Emeryville, CA 94608
1049 43rd Street Emeryville, CA 94608
Details & Description
Property Highlights
- • 12 1-bedroom, 1-bathroom units
- • Great rental upside
- • One-to-one offsite parking
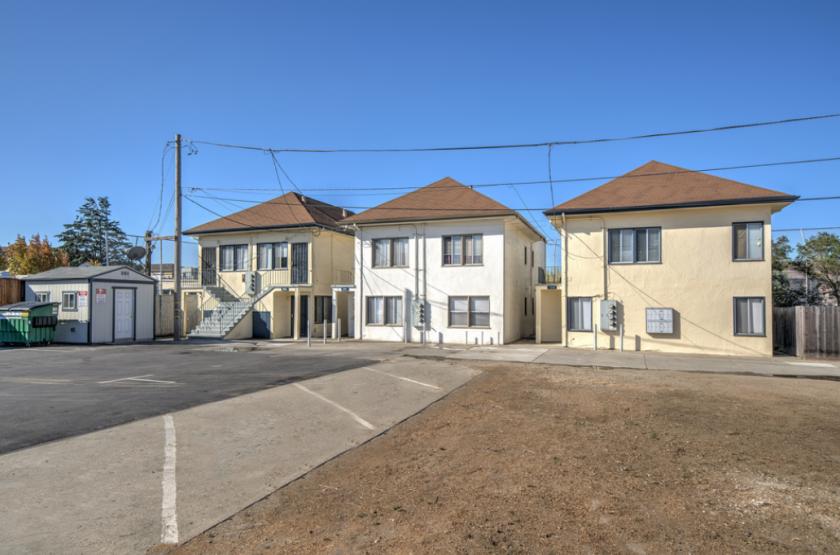
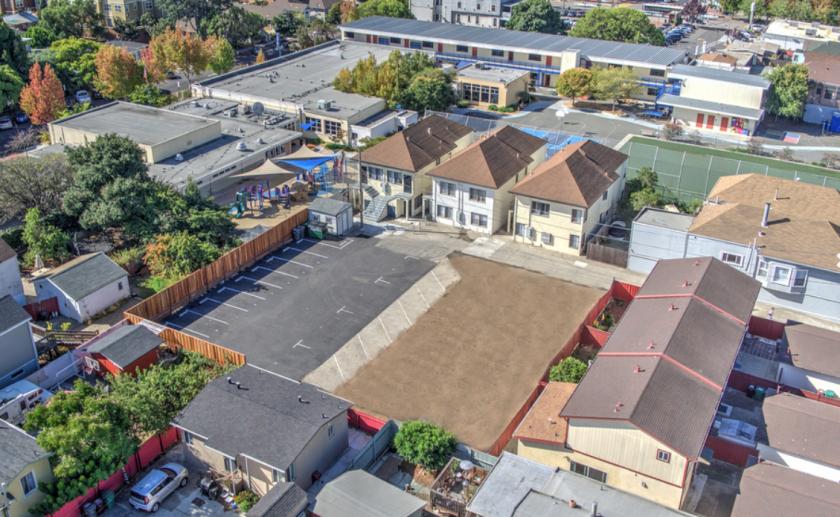
Additional Photos


Listing Agents

Rudas Gebregiorges
O: 510-244-3707
M: 510-828-1214
rudas@nainorcal.com
O: 510-244-3707
M: 510-828-1214
rudas@nainorcal.com

Ecaterina Bicova
O: 510-336-4713
M: 530-220-7147
kbicova@nainorcal.com
O: 510-336-4713
M: 530-220-7147
kbicova@nainorcal.com
While we strive to provide the most accurate information, all listing information, and demographic data, is provided by third-parties. As such, MyEListing will not be responsible for the accuracy of the information. It is strongly recommended that you verify all information with the listing agent, and any relevant agencies, prior to making any decisions.


